Michelle Tan || 7th October 2014
Abstract The analysis was carried out using X-Ray diffraction1–3 (XPertPro Panalytical) of polymorphic forms of Milk chocolate, Dark Chocolate and pure Cocoa Butter samples. Sugar was removed from the samples as sucrose signals interfere with those of cocoa butter. The XRD patterns obtained for the Milk Chocolate and Dark chocolate were compared to that of the pure cocoa butter. Strong peaks were observed at 4.16Å (Form I), 4.24Å (Form II), 4.24Å (Form III), 4.38Å (Form IV) and 4.56Å (Form V), which can be used to infer the various crystal structures of the polymorphs of cocoa butter. This lent itself well to the sensitivity of chocolate with respect to temperature and the need for close temperature monitoring during industrial chocolate manufacture.
Introduction Chocolate is amongst the various foodstuffs of our time to contain triacylglycerols mixed with sugar and cocoa solids. The fat content therefore determines the crystal structure of chocolate and its six distinct polymorphs. The polymorphs that the chocolate exhibits greatly affect the taste and texture of the final product and therefore it is imperative that the temperature and therefore the crystal structure are monitored during the manufacturing process. The polymorphs are as follows4,5
| Form | Melting Point (°C) | d-spacing (Å) |
| Form I (γ) | 14 | 4.18 |
| Form II (α) | 20 | 4.20 |
| Form III (β’) | 22 | 4.20 |
| Form IV (β’) | 24 | 4.32 |
| Form V (β) | 29 | 4.58 |
| Form VI (β) | 32 | 4.59 |
Table 1: Polymorphs and their respective literature melting points and d-spacings.
The optimal polymorphic form for large-scale manufacture and consumption is Form V. To ensure this, the raw chocolate has to be tempered to allow the crystals to form in an orderly fashion giving the coveted “melt-in-the-mouth” feel.
The reason for tempering the chocolate is to ensure than the chocolate only exists in the β(V) polymorph which is the most desirable for consumption as it melts only in the mouth and not in the hand. The tempering process involves heating the chocolate up to a temperature that will ensure all the fats in the chocolate melt and then subsequent cooling to allow for the initiation of nucleation sites for the chocolate crystals to grow. As the chocolate cools it is inevitable that other polymorphs will begin to form and so to ensure that only the β(V) polymorph is present, you heat the chocolate up again to melt all the other undesired forms4,5.
Triacylglycerols: (Main fat component in cocoa butter)
Stearic acid is the predominate saturated fat in cocoa butter; the remaining saturated fat is primarily palmitic acid. Oleic acid is then the primary monostaurated fat. The triacylglycerols (TAG) typically found in cocoa butter are 1,3 diplamitoyl-2 oleoyl glycerol (POP), 1-palmitoyl-2-oleoyl- 3-stearoyl-glycerol (POS) and 1,3-stearoyl-2-oleoyl-glycerol (SOS). There are also minor concentrations of binary mixtures of 1,2,3 trioleoyl glycerol (OOO) and 1,2,3 tripalmitoyl glycerol (PPP), PPP and POP, POP and 1 palmitoyl 2,3 dioleoyl glycerol (POO)6. Interestingly, each of these TAGs has their own polymorphs however each form still belongs to the following crystal structure classification γ,α,β,β’.
According to L. Zhang, S. Ueno, K. Sato et al7, the crystal structure of the TAGs are influenced by the “mixing behaviour of different TAGs having different types of fatty acid moieties”. This is of particular importance in chocolate as the cocoa butter content is a combination of a range of TAGs. The combinations will affect the “aliphatic chain packing, glycerol conformation, double-bond configuration and methyl end stacking 8,9” and hence will affect the polymorphic structures and therefore the d spacing as measured using the XRD machine. The relative stability of the various polymorphic forms are largely dependent on the temperatures fluctuations in particular the rates of heating and cooling. This is incredibly important in chocolate manufacture as the grinding of the cocoa beans can produce heat, therefore influencing the crystal structure of the final product. For cocoa butter the β phase is the most stable phase and consists of two different β polymorphs, a lower melting β2 phase (β-V form) and a higher melting β1 phase (β-VI form)10.
Materials and Method Three different samples were used for this project. Commercially available chocolate was used throughout the project. The first Frey Swiss Classic Dark Chocolate. The second one was Green & Black’s Organic Milk Chocolate. The pure cocoa butter sample was from Carribbean Cocoa©. The nutritional information of each chocolate is summarized in the table (table 2) below. None of the chocolates contained any vegetable fat so the entire fat content is due to the cocoa butter.
| Dark Chocolate | Milk Chocolate | Cocoa Butter | |
| Cocoa Butter (%) | 46 | 35.5 | 100 |
| Energy per 100g (kJ) | 2440 | 2340 | 3698 |
| Total Carbohydrates per 100g (g) | 31 | 50.3 | 0 |
| Cocoa (%) | ≥72 | ≥26 | 0 |
Table 2: Nutritional Information of chocolate and cocoa butter samples used. Nutritional information available on www.chocolatfrey.com, www.greenandblacks.com and http://nutritiondata.self.com/facts/fats-and-oils/570/2
Chocolate/Cocoa Butter samples were prepared according to the table below. Samples were melted to 45°C and then cooled according to the table below. However, to image the evolution of the polymorphs from Form 1-4, only Form I was prepared for all 3 samples (Dark, Milk and Pure Cocoa Butter).
| Form/ Melting Point | Description of method |
| Form I/17.3°C | Cool melted chocolate rapidly (by putting it in the freezer) |
| Form II/23.3°C | Cool melted chocolate at 2°C per minute. |
| Form III/25.5°C | Cool at 5-10°C |
| Form IV/27.3°C | Cool at room temperature (25°C) |
| Form V/33.8°C | Store bought chocolate as is |
Table 3: Method of producing polymorphic forms I-V11.
note: there is a sixth polymorphic form however, it takes an extended period of time to form and does not form without interference from other forms.
Tempered chocolate was taken directly from store bought bars and was chopped up finely and mixed with 500ml of cold deionized water and left at room temperature to dissolve the sugar12. The chocolate was filtered under a vacuum using a Buchner funnel and flask. The Chocolate solids were left to dry at room temperature and chopped up again and stored in airtight containers until it was ready for use. This chocolate was then placed in the aluminium holder and scanned using an XPert Pro Pananalytical Powder X Ray Diffractometer (Cu Radiation, λ = 1.5418Å). Analysis of the XRD pattern allowed for the d-spacing of the polymorphs to be determined. It is equally acceptable to complete this experiment without the removal of sugar; however, a cooling stage would be required in order to eliminate the peak produced by the sucrose.
In order to investigate the various polymorphs an XRD machine with a Peltier cold stage13 attached. This would allow the stage to be heated up at constant rate and held at regular temperature intervals for scans to be taken. Hence allowed for the d spacing of polymorphs Form 1-4 to be quantified.
However, a Peltier cold stage was not available so in order to overcome this problem, the chocolate was initially melted until molten state and then was placed in the metallic holder until the cavity was just barely filled and the surface is flat. It was then placed in a freezer and allowed to solidify and cool at a rapid rate in order to produce the form 1 polymorph. Then the metallic holder was then placed in the X-ray diffractometer to scan and allowed to slowly heat up all the while its temperature being monitored. The scan was done 10 times (Run time = 5 minutes) on the same sample and the d spacing of the polymorphs was measured using Bragg’s law nλ=2dsinθ.
Results and Discussion
Evolution of the cocoa butter structure in the diffractometer:
The cocoa butter can be initially crystallized at a cooling rate of 50°C per minute (to produce Form I) and then placed in the diffractometer at 0°C. A peak at d= 4.19Å5 is observable on the XRD pattern. When compared to a sample of Form I polymorph of chocolate the same peak is observed (all unstable crystals of chocolate). When the chocolate is heated up in the diffractometer to 15°C at 5°C per minute, it results in an XRD pattern with two peaks at d = 4.19 Å5 and d=4.56 Å5 both of relative intensity, indicating that the unstable crystals are becoming stable crystals as the sample is heated. This is observed in figures 2.1 – 2.6. Finally when 20°C is reached, the cocoa butter now only contains the stable crystals and has a XRD peak at d = 4.56 Å. – you can then integrate the peaks to quantify the concentration of each phase in the chocolate samples. The ability to quantify the relative amounts of each polymorph would be highly sought after by chocolate manufacturers to ensure that only Form V is present without interference from other forms.
Dark Chocolate
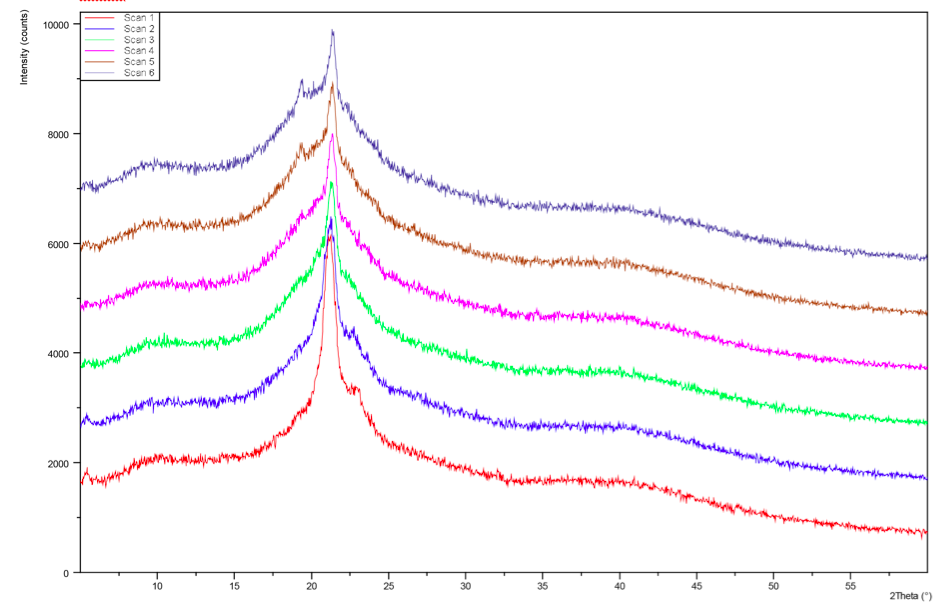
Figure 2.1: Dark Chocolate XRD pattern: Run Time (per scan): 2mins20seconds (Red = Scan 1, Dark blue = Scan 6). Red pattern has a strong peak at 4.18Å with small peak appearing on left at 4.48Å. (Recorded by Richard Sweeney: Department of Materials Imperial College London)
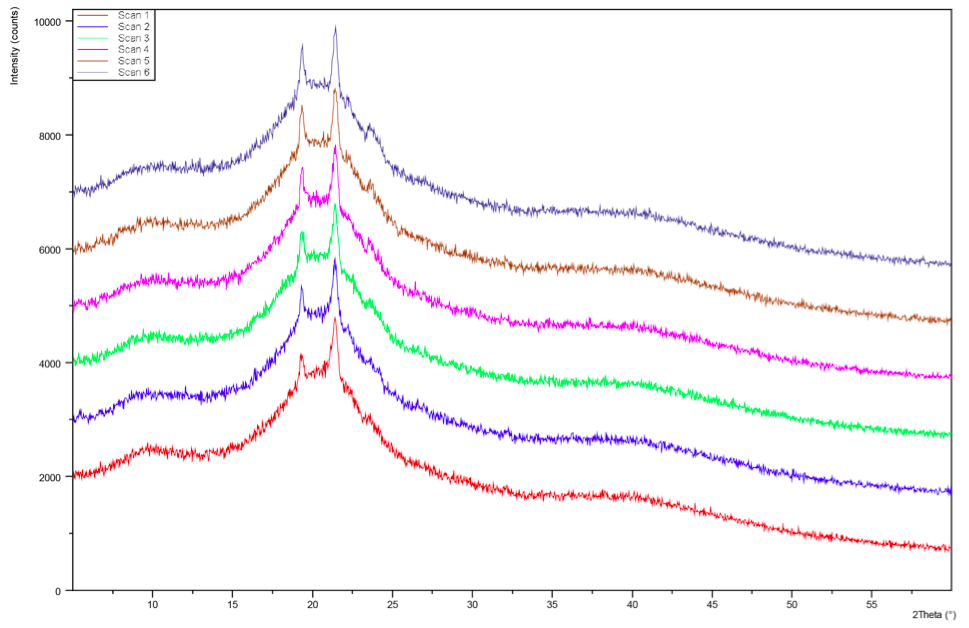
Figure 2.2: Dark Chocolate XRD Pattern: Run Time (per scan): 2mins20secs (Red = Scan 7, Dark Blue = Scan 12 (Total 28 mins after initial scan) Left peak 4.48Å, right peak 4.18Å. note: temperature was not recorded over all 12 scans. (Recorded by Richard Sweeney: Department of Materials Imperial College London)
It is clearly demonstrated on Figure 2.1 and 2.2 that there are distinguishing peaks between stable and unstable forms of chocolate. The stable forms having a distinct strong peak at 4.48Å and the unstable forms having a strong peak at 4.18Å. There is a gradual shift from the unstable polymorph to the more stable one. Yet, the scans do not show a gradual shift between polymorphs I-IV rather just the shift from unstable to stable. The scans below take into account the temperature of the sample holder, which allows more conclusive evidence to be drawn about the individual specific polymorphs based on their relative melting points.
Cocoa Butter
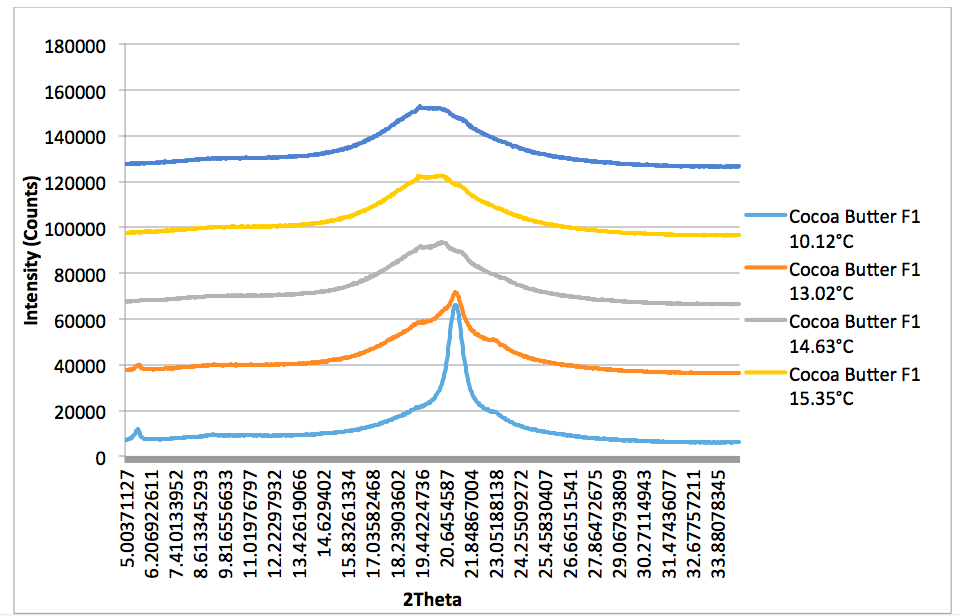
Figure 2.3: Cocoa Butter XRD Pattern: Run Time (per scan): 5mins. 10.12°C plot (light blue): Peak 4.16Å, 13.02°C/14.63°C/15.35°C plot (Orange, grey, yellow respectively): Peak 4.64Å. (Recorded by Richard Sweeney: Department of Materials Imperial College London)

Figure 2.4: Cocoa Butter XRD Pattern (Form I – Form IV): Run Time (per scan): 5mins. Peak on all plots: 4.62Å. (Recorded by Richard Sweeney: Department of Materials Imperial College London)
In Figures 2.3 and 2.4, a distinct shift is again observed for the pure cocoa butter sample however it is less pronounced than that of the dark chocolate. This may be due to lower melting point of the dark chocolate when compared to both pure cocoa butter and milk chocolate. This is primarily due to the milk fat in the milk chocolate which acts to lower the heat resistance of the chocolate therefore resulting in a higher melting point. Since cocoa butter is purely fat it has the highest melting point of the three. This therefore has the knock on effect on the evolution of the polymorphs with respect to temperature. The dark chocolate samples exhibit a more significant shift from Form I to Form IV whereas it is much less pronounced for the cocoa butter samples. If the heating regimen could be controlled, the heating rate could be tuned for each sample in order to be able to see the distinctive peak for each polymorph.
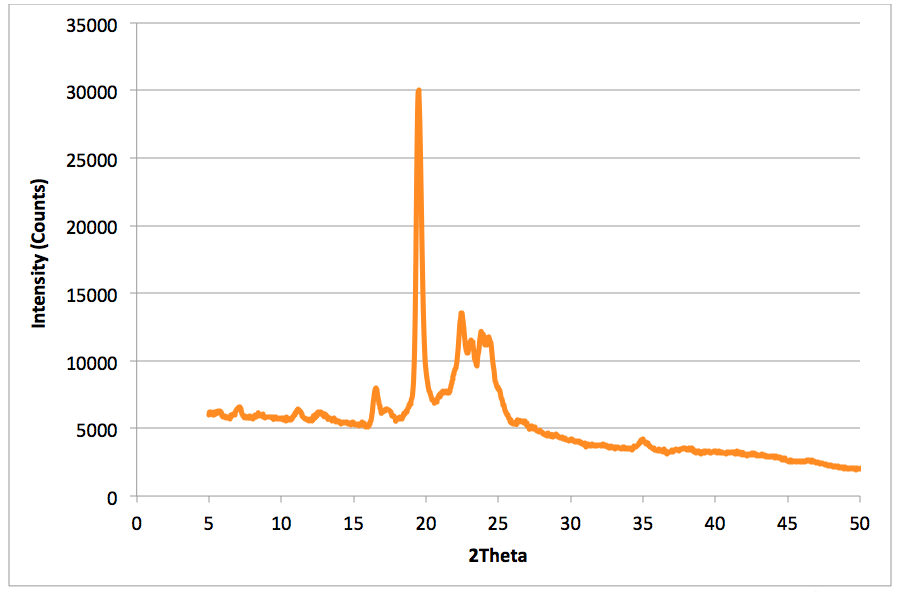
Figure 2.5: Dark Chocolate XRD Pattern (Form V) – Peak (d spacing): 3.98Å, 4.56Å, 5.41Å (Recorded by Richard Sweeney: Department of Materials Imperial College London)
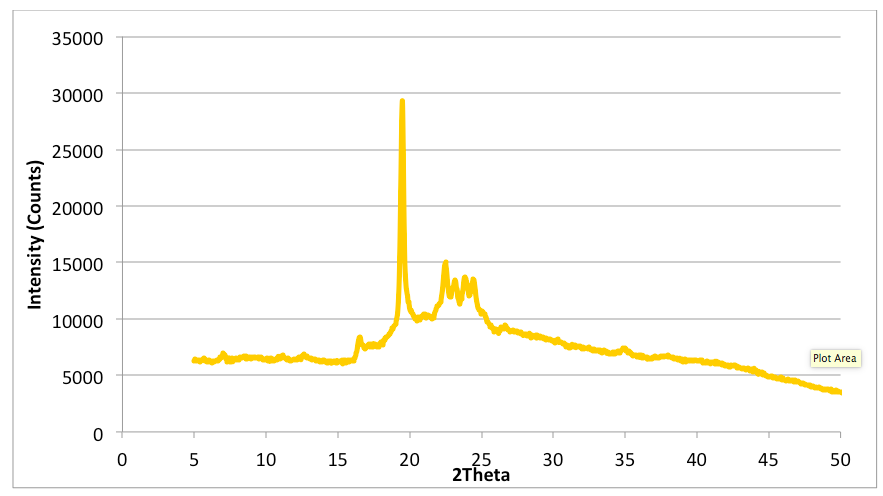
Figure 2.6: Milk Chocolate XRD Pattern (Form V) – Peak (d spacing): 3.97Å, 4.56Å, 5.40Å. (Recorded by Richard Sweeney: Department of Materials Imperial College London)

Figure 2.7: Cocoa Butter Pattern (Form V) – Peak (d spacing): 3.72Å, 4.57Å, 5.49Å (Recorded by Richard Sweeney, Department of Materials Imperial College London)
Figures 2.5, 2.6 and 2.7 show the XRD pattern for Form V alone and there is an observed strong peak at 4.56Å (For Dark and Milk Chocolate) and 4.57Å which is indicative of the Form V polymorph as indicated in Table 1. It is apparent that the intensity for the cocoa butter is 5 times greater in magnitude than either the dark chocolate or milk chocolate samples as it is pure without interference from the milk solids and other added ingredients.
There was no access to a Peltier temperature stage and the thermocouple was unable to be attached directly to the sample holder whilst scanning was taking place. Therefore, the sample holder’s temperature was monitored separately over the same time period as the total sampling time on the X-ray diffractometer (50mins). Figure 2.7 depicts the heating curve for the solid sample holder monitored over 50 minutes.
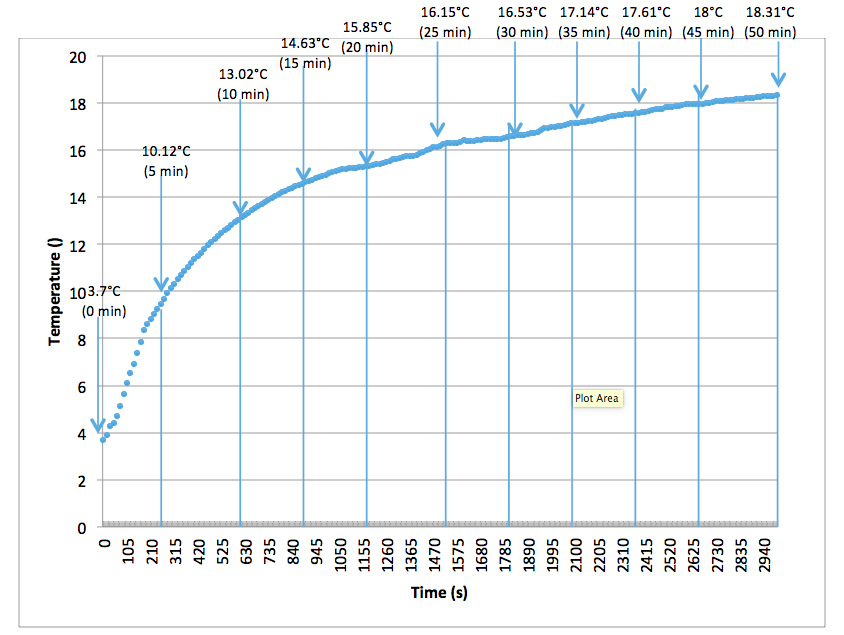
Figure 2.8: Heating curve for sample holder over 50 minutes (Recorded using TC-08 Omega Thermocouple).
Effect of the project on the field:
There are two groups of chocolate polymorphs, those that are stable and unstable at room temperature. Cooling molten chocolate rapidly produces the unstable polymorphs, whilst cooling slowly produces the stable versions.
Hence, it is imperative that you ensure slow cooling process in the industrial manufacture of chocolate. A plunger is typically used to form chocolate into a range of shapes (Figure 2.9). The cooling rate used in most industrial manufacture of chocolate is 10-15°C14 to form the final solid (Form V) product. The cooling rate however, must be closely monitored in order to prevent large crystals being formed quickly instead of smaller crystals being formed more gradually. In the small artisan chocolate shops, the cooling process is usually done on a marble surface where the temperature of the marble can be controlled to ensure slow cooling and the production of just one of the polymorphs of chocolate (V). Fast cooling rates will lower the quality of the final product and potentially could lead to the acceleration of fat bloom.
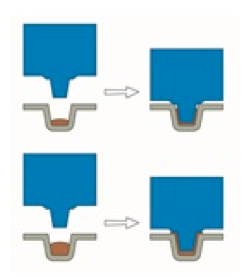
Figure 2.9: Cold pressed chocolate process.15
Conclusion
XRD patterns were obtained from dark chocolate, milk chocolate and cocoa butter samples. The evolution of the Form I chocolate polymorph to Form IV is shown in Figures 2.1-2.4. The results of the experiment compare well with the literature and the dark chocolate and milk chocolate samples are compared with pure cocoa butter samples prepared using the same conditions. The findings are of great value to chocolate manufacturers as they can use the data to ensure that each stage of their manufacturing process adheres to the scientific findings that temperature can indeed reduce the quality of the chocolate significantly.
Bibliography:
- S. Bakalis, B. J. D. Le Révérend, N. Z. R. Anwar and P. J. Fryer, Procedia Food Science, 2011, 1, 340–346.
- S. D. MacMillan, C. A. Peacock, K. Roberts, A. Rossi, M. A. Wells, M. C. Polgreen and I. H. Smith, .
- G. M. Chapman, E. E. Akehurst and W. B. Wright, Journal of the American Oil Chemists Society, 1971, 48, 824–830.
- C. Loisel, G. Keller, G. Lecq, C. Bourgaux and M. Ollivon, Journal of the American Oil Chemists’ Society, 1998, 75, 425–439.
- R. L. Wille and E. S. Lutton, Journal of the American Oil Chemists Society, 1966, 43, 491–496.
- M. Buchgraber, S. Androni and E. Anklam, Journal of agricultural and food chemistry, 2007, 55, 3284–91.
- L. Zhang, S. Ueno, K. Sato, R. O. Adlof and G. R. List, Journal of Thermal Analysis and Calorimetry, 2009, 98, 105–111.
- K. Sato, S. Ueno and K. Yano, Prog. Lipid Res., 1999, 38, 91–116.
- K. Sato and S. Ueno, in Crystallization Processes in Fats and Lipid Systems, eds. N. Garti and K. Sato, Marcel Dekker, New York, 2001, pp. 177–209.
- J. B. van Mechelen, R. Peschar and H. Schenk, Acta Cryst., 2006, B62, 1121–1130.
- US6419970 B1, 2002.
- L. M. Nightingale, S.-Y. Lee and N. J. Engeseth, Journal of food science, 76, C142–53.
- B. J. D. Le Révérend, P. J. Fryer, S. Coles and S. Bakalis, Journal of the American Oil Chemists’ Society, 2009, 87, 239–246.
- E. L. Keijbets, J. Chen and J. Vieira, Journal of Food Engineering, 2010, 98, 133–140.
- Aasted, 2011.