by Dr Flora Whitmarsh, Grantham Institute
 In an article for the Telegraph, Christopher Booker gave his views on Professor Sir Brian Hoskins’ appearance on the Today programme earlier this year. In the article, Booker made several claims about climate science relating to rainfall, atmospheric humidity, polar sea ice extent, global temperatures and sea level rise. In this blog I will assess his claims against the findings of the latest report of Working Group 1 of the Intergovernmental Panel on Climate Change (IPCC), a hugely comprehensive assessment of the scientific literature.
Rainfall and floods
Booker’s comment: “Not even the latest technical report from the UN’s Intergovernmental Panel on Climate Change (IPCC) could find any evidence that rainfall and floods were increasing.”
Scientific Evidence:
The IPCC report found a significant climate influence on global scale changes in precipitation patterns (with medium confidence), including increases in precipitation in northern hemisphere mid to high latitudes. Further evidence of this comes from the observed changes in sea level salinity, an indication of the global distribution of evaporation and precipitation. The data is currently too inconclusive to report other regional changes in rainfall with confidence. Overall, however, there had been little change in land-based precipitation since 1900, contrasting with their 2007 assessment, which reported that global precipitation averaged over land areas had increased.
The IPCC concluded that there continues to be a lack of evidence and thus low confidence regarding the sign of trend in the magnitude and/or frequency of floods on a global scale.
The IPCC’s projected short-term changes (2016-35) in rainfall were:
- Increased mean precipitation in the high and some of the mid latitudes (very likely)
- Reductions in the sub-tropics (more likely than not).
There is also likely to be an increase in the frequency and intensity of heavy precipitation events over land. Regional changes will be strongly affected by natural variability and will also depend on future aerosol level (emissions and volcanic) and land use change.
Global rainfall totals are expected to go up in the longer term (i.e. beyond 2035) by around 1-3% per degree Celsius of global mean surface temperature increase, except in the very lowest emissions scenario.
Booker is partially right on past changes: the IPCC found no significant trend in global average rainfall over land. But this is not to say there has been no effect. Indeed, the expected increase in extreme heavy rain is already happening: the IPCC concluded with medium confidence that since 1951 there has been an increase in the number of heavy precipitation events in more regions than have had a decrease.
Read more about the impacts of climate change on UK weather
Atmospheric humidity
Booker’s comment: “From the official National Oceanic and Atmospheric Administration (NOAA) satellite data on humidity (shown on the “atmosphere page” of the science blog Watts Up With That), we see it has actually been falling.”
Scientific Evidence:
The key measure of whether atmospheric humidity is rising or falling is specific humidity, i.e. the mass of water vapour in a unit mass of moist air. The “atmosphere page” of “Watts Up With That” when accessed on 17 July wrongly shows data on relative humidity under the heading “Specific humidity”. Relative humidity is a measure that depends on temperature and does not therefore measure the absolute water vapour content of the atmosphere. In other words, Booker’s evidence is not evidence.
The latest IPCC report concludes that it is very likely that global near surface and tropospheric air specific humidity have increased since the 1970s. However, during recent years the near-surface moistening trend over land has abated (medium confidence). The magnitude of the observed global change in water vapour of about 3.5% in the past 40 years is consistent with the observed temperature change of about 0.5°C during the same period. The water vapour change can be attributed to human influence with medium confidence.
Polar ice melt
Booker’s comment: “As for polar ice, put the Arctic and the Antarctic together and there has lately been more sea ice than at any time since records began (see the Cryosphere Today website).”
Scientific Evidence:
The IPCC found that since 1979, annual Arctic sea ice extent has declined by 0.45-0.51 million km2 per decade and annual Antarctic sea ice extent has increased by 0.13-0.20 million km2 per decade. Taking the two IPCC estimates together, it can be inferred that total global sea ice extent has declined since 1979.
Sea ice thickness is harder to measure. The IPCC combined submarine-based measurements with satellite altimetry, concluding that Arctic sea ice has thinned by 1.3 – 2.3 m between 1980 and 2008. There is insufficient data to estimate any change in Antarctic sea ice thickness.
The reason why the Arctic sea ice has declined and the Antarctic sea ice hasn’t is because they have very different characteristics. Arctic sea ice is constrained by the North American and Eurasian landmasses to the south. In the central Arctic Ocean, the ice can survive several years, which allows it to thicken to several meters. Due to climate warming, the Arctic summer minimum has declined by around 11.5% per decade since 1979, and the extent of the ice that has survived more than two summers has declined by around 13.5% per decade over the same period. This has serious consequences for the surface albedo (reflectance) of the Arctic, as a reduction in the highly reflecting sea ice with less reflective open water results in enhanced absorption of solar radiation.
In contrast to the Arctic, Antarctic sea ice forms in the open ocean with no northern land to constrain its formation. The vast majority of Antarctic sea ice melts each summer.
Booker mentioned sea ice specifically, but he did not mention the other important components of the global cryosphere. Making use of better observations than were available at the time of their previous report in 2007, the IPCC carried out an assessment of all the ice on the planet and concluded that there had been a continued decline in the total amount of ice on the planet. The Greenland and Antarctic ice sheets are both losing mass (with very high confidence and high confidence respectively). Glaciers are known to be declining globally (with very high confidence). Overall snow cover, freshwater ice and frozen ground (permafrost) are also declining, although the available data is mostly for the Northern hemisphere.
Temperature
Booker says: “As for Sir Brian’s claim that by 2100 temperatures will have risen by a further ‘3-5oC’, not even the IPCC dares predict anything so scary.”
Scientific evidence:
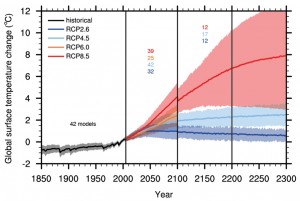
Future temperature rise of course depends on greenhouse gas emissions. In the lowest of the IPCC emissions scenarios, which assumes that global carbon dioxide emissions will decline after 2020, reach zero around 2080, and then continue dropping to just below zero by 2090, temperatures are projected to increase by another 0.3oC – 1.7oC by 2100. Total warming under this scenario is projected to be 0.9oC – 2.3oC relative to 1850-1900, i.e. including warming over the 20th century. Under the highest emissions scenario, the closest to business as usual, another 2.6oC – 4.8oC of warming is projected by 2100. In this case, the total projected temperature rise by 2100 is 3.2oC – 5.4oC when past temperature rise is included.
It is worth emphasising that if emissions are not constrained then we are likely to see a temperature rise of the same order as the projections under the IPCC’s highest emissions scenario. All three of the other scenarios assume that carbon dioxide emissions will peak and then decline substantially at some point in the coming decades. If emissions continue to rise then we should expect a total temperature increase in the region of 3.2oC – 5.4oC by the end of the century. This can of course be avoided if action is taken to reduce fossil fuel dependency.
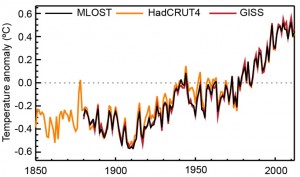
Booker says: “[Professor Hoskins] was never more wobbly than when trying to explain away why there has now been no rise in average global temperatures for 17 years, making nonsense of all those earlier IPCC computer projections that temperatures should by now be rising at 0.3C every decade.”
Scientific evidence:

Climate change is a long term trend, and a few decades worth of data are needed to separate the warming trend from natural variability. Global mean surface temperature increased by about 0.85oC over the period 1880-2012. Each of the last three decades has been warmer than all previous decades in the instrumental record and the decade of the 2000s has been the warmest.
The observed temperature record over the 20th Century shows periods of slower and faster warming in response to a number of factors, most notably natural variability in the climate system, the changes in atmospheric composition due to large-scale human emissions of greenhouse gases and aerosols from burning fossil fuels and land-use change, volcanic activity and small changes in the level of solar activity.
In future, there will continue to be natural variation in temperature as well as a long term warming trend due to our greenhouse gas emissions. Significant natural climate variability means that a prolonged continuation of the current slowdown in the rate of increase would not on its own be strong evidence against climate change, provided that: 1) the global mean sea level continued to rise due to thermal expansion of the oceans, the melting of glaciers and loss of ice from ice sheets, and 2) the measured net energy flow into the climate system (predominantly the ocean) remained significantly positive.
The climate models used by the IPCC are not designed to predict the exact temperature of the Earth surface in a particular year or decade. This would require scientists to predict the future state of climatic phenomena such as the El Niño Southern Oscillation or the Pacific Decadal Oscillation for a specific period several years in advance, something that is not currently possible. Volcanic eruptions also have an impact on global temperatures, and they are not known about far enough in advance to be incorporated into the IPCC’s model projections.
Read more in our Grantham Note on the slowdown in global mean surface temperature rise

Sea level rise
Booker says: “NOAA’s data show that the modest 200-year-long rise in sea levels has slowed to such an extent that, if its recent trend continues, by the end of the century the sea will have risen by less than seven inches.”
Scientific evidence:

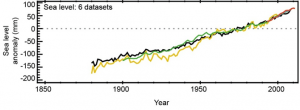
The IPCC assessed the relevant data carefully and concluded that sea level rose by around 19 cm (about 7 ½ inches) between 1901 and 2010. This is based on tide gauge data, with satellite data included after 1993. The rate of sea level rise was around 3.2 mm (about 1/8th inch) per year between 1993 and 2010. This is faster than the overall rate since 1901, indicating that sea level rise is accelerating as would be expected from thermal expansion of seawater and increased melting of ice on land.
Future sea level projections under the highest IPCC emissions scenario tell us what is likely to happen if emissions continue to rise unabated. In this case, sea level is projected to increase by a further 63 cm (about 24 ¾ inches) in the last two decades of this century compared with the 1986-2005 average. Even in the lowest emissions scenario, which requires substantial emissions reductions, another 40 cm (about 15 ¾ inches) of sea level rise can be expected by 2100.
Read more in our Grantham Note on sea level rise.
Reference for figures:
IPCC, 2013: Climate Change 2013: The Physical Science Basis. Contribution of Working Group I to the Fifth Assessment Report of the Intergovernmental Panel on Climate Change [Stocker, T.F., D. Qin, G.-K. Plattner, M. Tignor, S.K. Allen, J. Boschung, A. Nauels, Y. Xia, V. Bex and P.M. Midgley (eds.)]. Cambridge University Press, Cambridge, United Kingdom and New York, NY, USA, 1535 pp.