Hi, I’m Sharia, a third-year MEng Computing student at Imperial. I was raised in Tehran, Iran, and I’ve always had a passion for music. I enjoy playing Flamenco guitar and the traditional Persian instrument, the Tar. In my free time, I like to stay active by playing basketball, and I also enjoy CTF challenges.
 In a recent visit to Imperial’s Data Observatory, I embarked on a journey through the realms of data visualization that left me profoundly enlightened. Nestled within the heart of the Department of Computing, the observatory is a beacon of innovation where data transcends mere numbers to reveal intricate patterns and unseen insights.
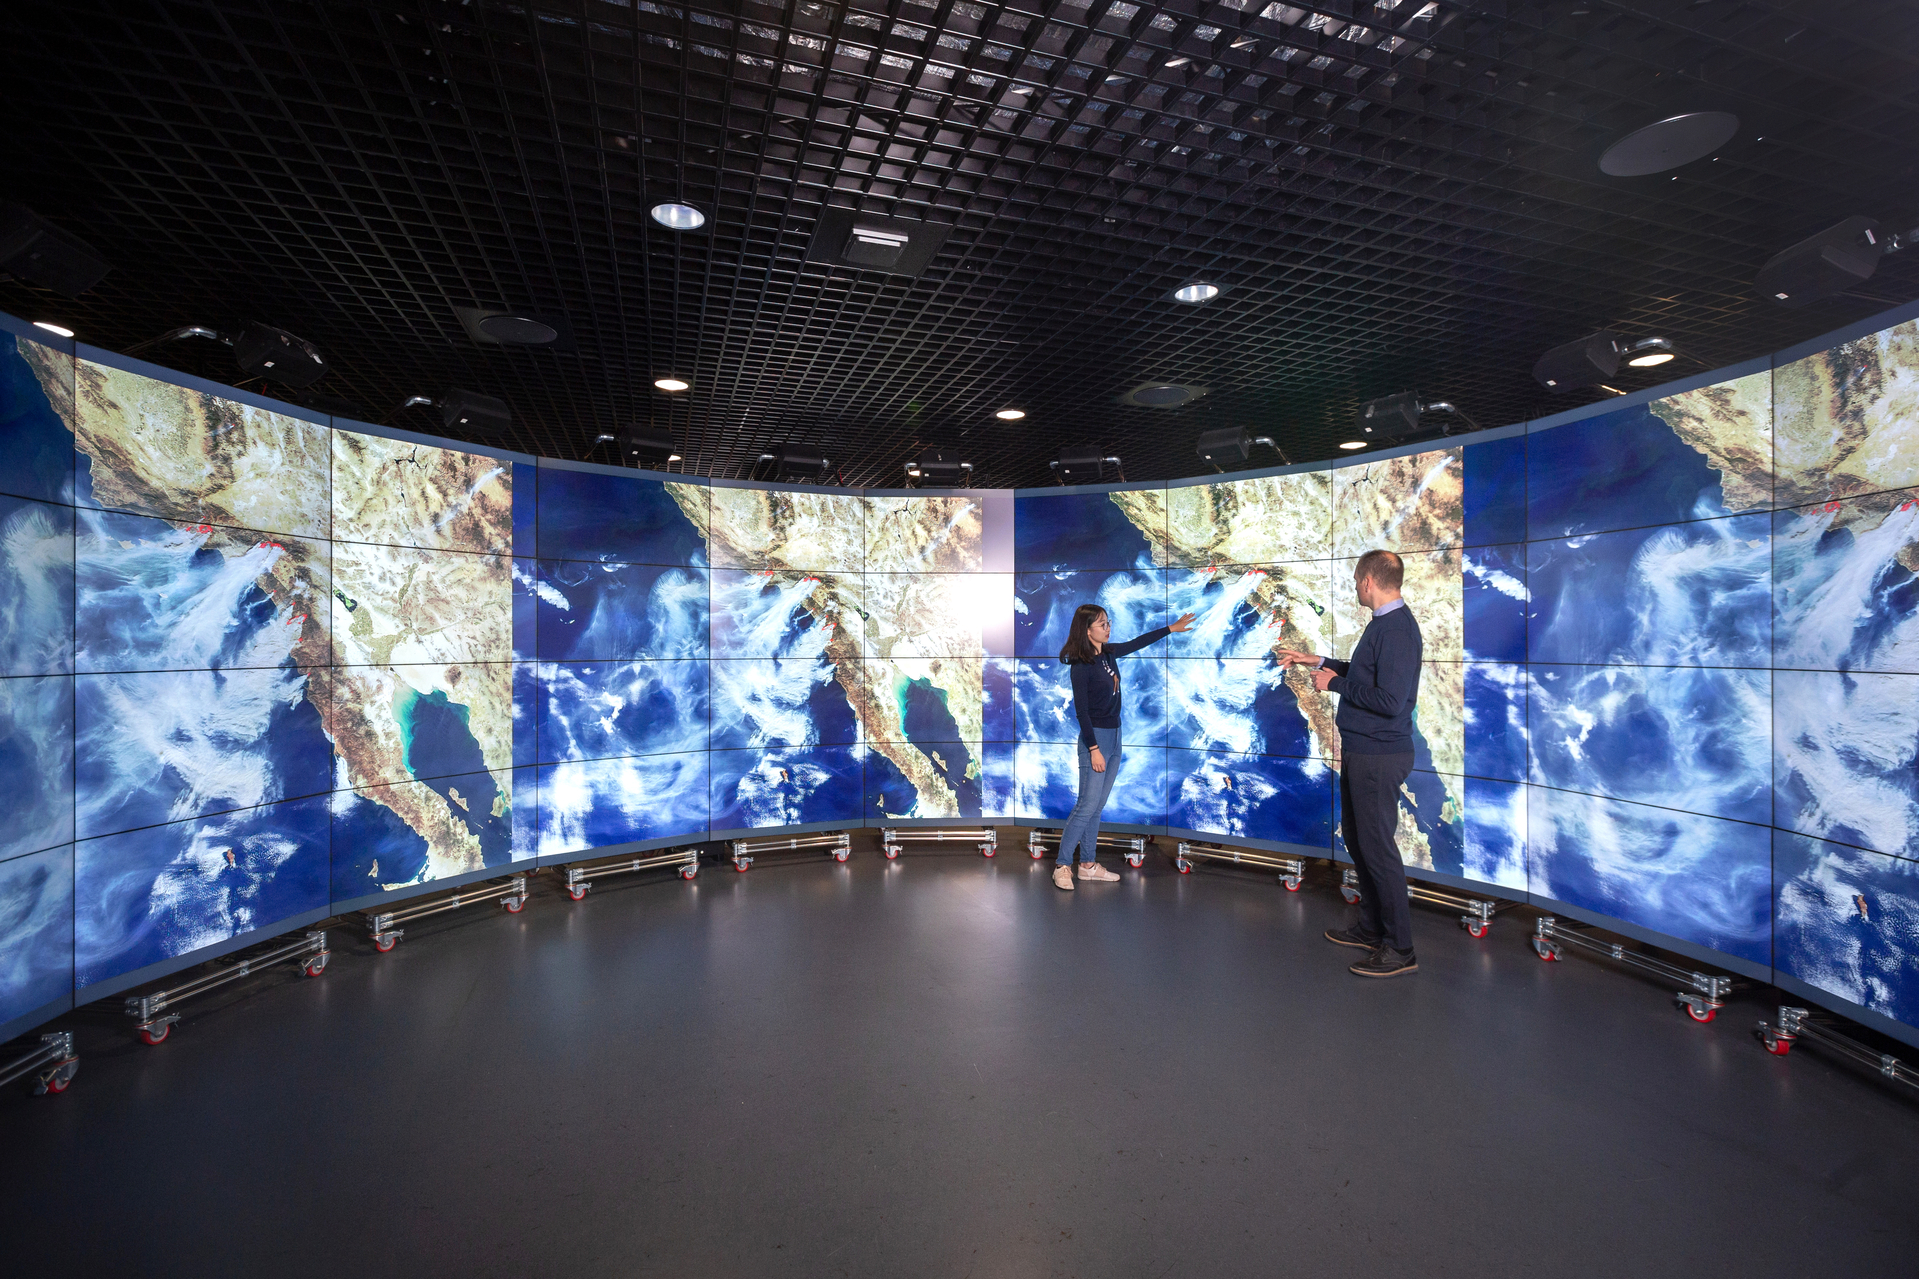
The Data Observatory is the largest of its kind in Europe, it features an enveloping circular wall of 64 monitors powered by 32 computers facilitating 313 degrees of surround vision. Over 130 million pixels make up the total screen resolution, allowing participants to experience big data like never before.
Among the myriad projects showcased, one stood out with exceptional clarity—the visualization of Bitcoin transactions. Here, every node represented an account, intricately connected by edges colored in shades of blue and yellow, symbolizing the flow of transactions. Initially, what appeared to be a visual anomaly—an unusual pattern amidst the data flow—soon unveiled itself as more than just a glitch.
Engaging with the student researcher behind the project, initial assumptions of a coding error soon evolved into a pivotal discovery. What was initially dismissed as a potential bug in the visualization turned out to be a visual signal of a significant cyber threat looming over the Bitcoin network. Subsequent investigation confirmed that the visual anomaly corresponded with a foiled attempt to breach the network—an attempted cyberattack of substantial magnitude.
Reflecting on this revelation, it became starkly evident how data visualization serves as a critical tool in modern cybersecurity. Beyond the aesthetic appeal of visual representation, such tools have the power to unmask hidden threats and anomalies that evade traditional data scrutiny methods. In an era where digital landscapes are fraught with risks, the ability to swiftly detect and respond to such threats can be the decisive factor in safeguarding critical infrastructures.
My visit to Imperial’s Data Observatory underscored the transformative role of data visualization not only within academia but across diverse sectors. It reinforced the notion that beyond its academic allure, data visualization stands as a formidable ally in the perpetual battle to secure our digital ecosystems.
As I departed from the observatory, I carried with me a renewed appreciation for the profound impact of data in shaping our understanding of the world. The experience served as a testament to the pivotal role played by institutions like Imperial in pioneering innovations that redefine the boundaries of knowledge and security.
This visit was not just an exploration of data—it was a revelation of its potential to safeguard and empower our future.
Sharia Behrouzi, Department of Computing, Imperial
Special thanks to Brython Caley-Davies