

During the COVID-19 pandemic, mathematical modelling has received a lot of attention from policy makers and the general public. Computer models are developed, adapted and refined by humans to do things like making projections or forecasts (i.e., an estimation of a future situation based on present trends).
Computer models are developed, adapted and refined by humans to do things like making projections (i.e., what would the future look like if current trends were to continue?) or forecasts (i.e., what will the future actually look like?). It is interesting to consider how human judgement alone compares against model-based forecasts.
What did we do?
To look into this, we launched the UK COVID-19 Crowd Forecasting Challenge, a competition in which experts and non-experts alike were asked to predict the spread of COVID-19 in the UK. Participants were invited to take part in the challenge through
the online VOICE platform, as well as through Twitter and through relevant mailing lists.
Over a period of 13 weeks from May 24th until August 16th 2021, 93 human forecasters predicted COVID-19 cases and deaths in the UK. Each week, participants were asked to make a prediction one to four weeks into the future.
We combined the predictions of all human forecasters who took part in the UK Forecasting Challenge by taking the median (i.e., selecting the forecast in the middle of all predictions; see Image 2). These combined forecasts, or ‘ensembles’ usually perform better than people making individual predictions.
This ensemble of all forecasts, which we called ‘epiforecasts-EpiExpert’ or ‘crowd forecast’, was submitted to the European Forecast Hub, which collects COVID-19 forecasts from different research groups. The forecasts submitted to the European Forecast Hub by other research institutions were based on computational models, so comparing these against our crowd forecasts made for an interesting case study.
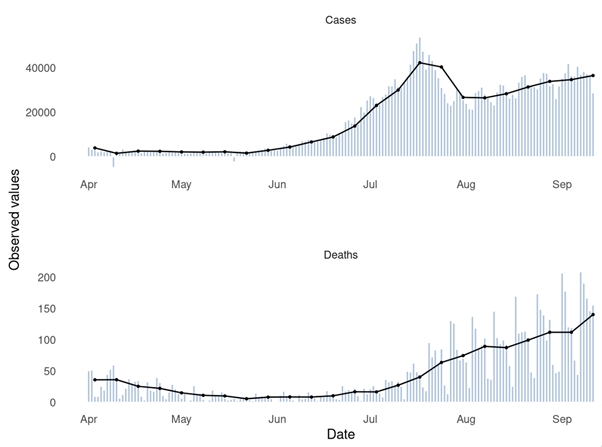
The UK Forecasting Challenge spanned a long period of rising COVID-19 rates as well as a sudden drop in cases at the end of July 2021. The image below provides a visualisation of daily (bars) and weekly (lines) reported cases and deaths.
Human forecasters were asked to make “point forecasts” (i.e. one exact number) to predict both COVID-19 cases and deaths, as well as provide an estimate of the uncertainty of these predictions (i.e. a range of likely values above and below their “point” predictions).
What did we find?
The image below shows the point predictions made during the UK Forecasting Challenge. The ‘epiforecasts-EpiExpert’ ensemble point forecasts (i.e. the median of all participants’ predictions) are shown in red and individual forecasts are shown in gray. The COVID-19 cases and deaths which were actually reported in the UK (by the UK Government) are shown in black. Every line represents a prediction made one to four weeks into the future on a given week.
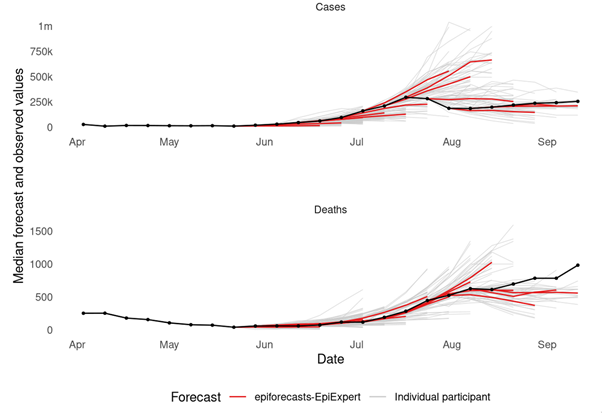
We can see that especially around the time of peak COVID-19 case numbers in July 2021, forecasters struggled to predict the trend correctly. None of the forecasters predicted a downturn of case numbers on July 19th 2021, the week of the peak. However, model-based forecasts also struggled to predict this.
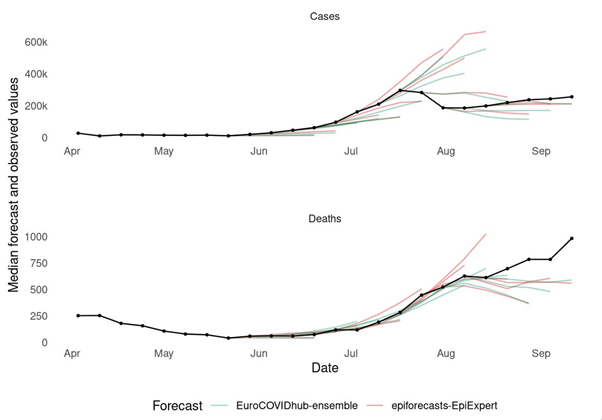
The following image compares the median ensemble of human forecasters (in red) with the median ensemble of all the model-based forecasts submitted to the European Forecast Hub (in green):
How were forecasts evaluated?
Forecasts are usually evaluated using so-called ‘proper scoring rules’ which ensure that no one can cheat. For the UK Crowd Forecasting Challenge, we used a proper scoring rule called “weighted interval score” (WIS). We evaluated all forecasts on a so-called logarithmic scale, meaning that any forecasting error can be interpreted in relative terms. For example, predicting 110 instead of 100 is equivalent to predicting 1100 instead of 1000, as both are a relative error of 10%. Using an absolute scale for the example give, these two errors would be different, as an absolute error of 100 (1100 vs 1000) is larger than an absolute error of 10 (110 vs 100).
How did human forecasters do?
When evaluated on a logarithmic scale (i.e. in relative terms as explained above), our human forecasts outperformed the ensemble of all the other model-based forecasts submitted to the European Forecast Hub by many different research institutions, both when predicting COVID-19 cases and deaths. When evaluated on an absolute scale, model-based approaches had an edge over human forecasts. This is mostly due to the fact that model-based approaches were able to predict the peak in cases slightly better than our human forecasters.
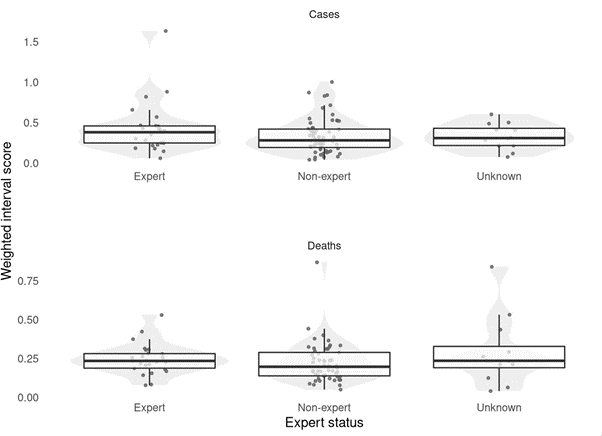
Interestingly, human forecasters who self-identified as ‘experts’ in either epidemiology (the science of the transmission and control of diseases) or statistics, did not perform better than non-experts at forecasting COVID-19 cases and deaths. Given the difficulty level of the task and the relatively low number of human forecasters (most of whom only made one or two predictions), we have to be careful when attempting to draw general conclusions. However, it is interesting to learn that in this challenge ‘non-experts’ could make an important contribution to forecasting the spread of COVID-19, making predictions which were about equally as good as model-based forecasts from renowned research institutions.
What’s next?
The UK Forecasting Challenge was part of a larger research effort to improve infectious disease forecasting. The UK Forecasting Challenge data is not yet published, but data from an earlier study carried out in Germany and Poland is available as a pre-print online. In the future we plan to investigate further the circumstances in which either human or model-based forecasts perform better, and also how the two may be combined. We are excited about the potential to combine human and model-based predictions to deliver valuable insights to policy makers.
This blog entry has been written by Nikos Bosse, a PhD in infectious disease forecasting at the Centre for the Mathematical Modelling of Infectious Diseases (CMMID) at the London School of Hygiene & Tropical Medicine. Nikos also works as part of the NIHR Health Protection Research Unit (HPRU) in Modelling and Health Economics at Imperial College, London. He works on forecasting, forecast evaluation and the comparison of human and model-based predictions.
This blog post has been cross-posted from the VOICE at Global Online Platform, it has been cross-promoted on the PERC blog, with permission, to ensure it reaches a wider audience.