Can we measure research in a more meaningful way? A quick look at the 2025 PLOS Open Science Indicators dataset

Why measuring open research matters
Open access publishing is sometimes mistakenly thought of as the be-all-and-end-all of open research (or open science). But while open access is important, it is not enough to capture the full breadth of research contributions, outputs and impacts. There are other indicators that can tell us more about the openness and quality of research than journal-related metrics do.
The research community is adopting more open research practices. After all, research is about more than just publishing the final outcome. It involves the processes that produce it. Measuring the open access level of publications gives a narrow insight about research. It should ideally cover other pillars – such as sharing data and code, embracing preprints, and adopting transparent research protocols – for reliable and high-quality research.
Measuring the level of open research adoption could provide valuable insight into how far the community has progressed on the path toward openness. It would also allow us to advocate what practices researchers can implement to make their work more reliable. Perhaps, most importantly, open research indicators can offer a better alternative to unfruitful – even unhealthy – metrics that have created a research culture of perverse incentives, like Journal Impact Factor and h-index. Measuring open research is not easy due to the unsystematic adoption of practices and their application on publications, such as not including code used for research or a dataset made available on request. Unlike open access, these practices are not yet fully mature. Researchers may also overlook making their open research activities visible, even when they may already be engaging in them. Therefore, understanding and demonstrating the extent of adoption is important for raising awareness and fostering broader engagement.
Measuring open research is hard, but PLOS proves it can be done
The academic publisher PLOS has been working on this challenging task of measuring open research principles. Partnering with DataSeer (an AI-based tool that checks manuscripts for identifiers of open practices), they have been releasing the comprehensive PLOS Open Science Indicators (OSI) dataset since late 2022 containing open research indicators, such as data availability/share, code availability/share, and preprint adoption.
The latest version of the OSI dataset has a total of 138,995 PLOS research articles published between 2018 and March 2025 (see here for their methodology). The 2025 OSI dataset expands on previous versions by including two new indicators: protocol-sharing and study (pre)registration. Previous versions only had data availability/sharing, code availability/sharing and preprint posting. In this blog, I analyse publications of Imperial College London within the OSI dataset. It aims to 1) understand the level of open research adoption at Imperial 2) outline a simple methodology that other institutions can easily implement for their own analyses.
Methods to identify Imperial research outputs in the OSI dataset
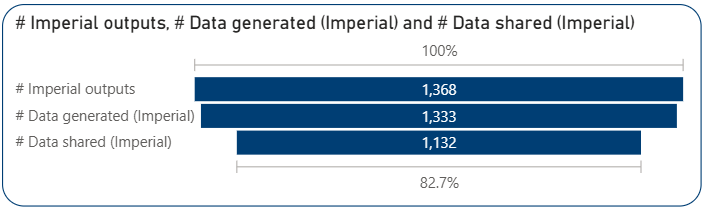
A simple methodology of matching research outputs of Imperial College London within the OSI dataset through DOIs is used. By using the internal Power BI report which is connected to Imperial’s current research information system, ‘journal article’ type items with a DOI published between 2018-2025 were downloaded (DOI is preferred as it allows matching outputs with a unique identifier). 1,368 out of 94,384 outputs matched the PLOS OSI dataset, representing 1.45% of Imperial’s total journal articles and accounting for nearly 1% of the entire PLOS dataset.

Findings: open research practices at Imperial
97% of the Imperial articles have generated data. It is not surprising to see the high percentage of data-sharing (nearly 85% of articles that generated data) in Imperial outputs in the OSI dataset because of Imperial’s active data management policies and publisher/funder data availability requirements. Data sharing is nearly 9% higher among Imperial articles compared to the overall PLOS dataset.
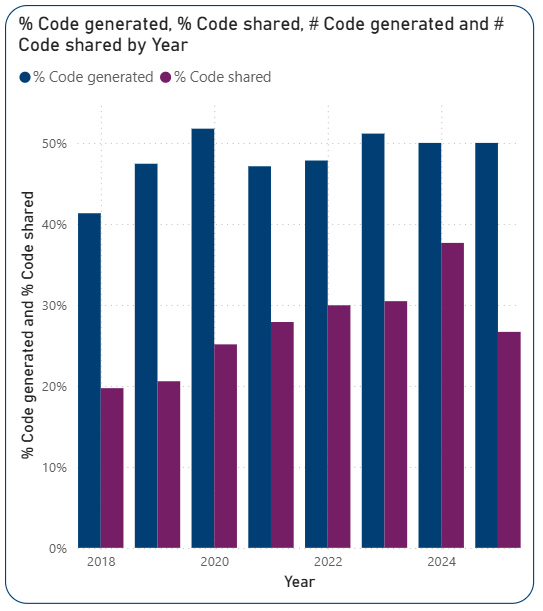
Accessing code which is the basis of research data generated within the output is vital for research integrity and reproducibility. Although there has been some improvement, codesharing isn’t as developed as data-sharing.
Nearly half of Imperial’s publications in the OSI dataset involved code generation. However, among those that did use code, only 56% have shared it, meaning that readers cannot ask the right questions about the reliability of the code underpinning the analysis in almost half the dataset.
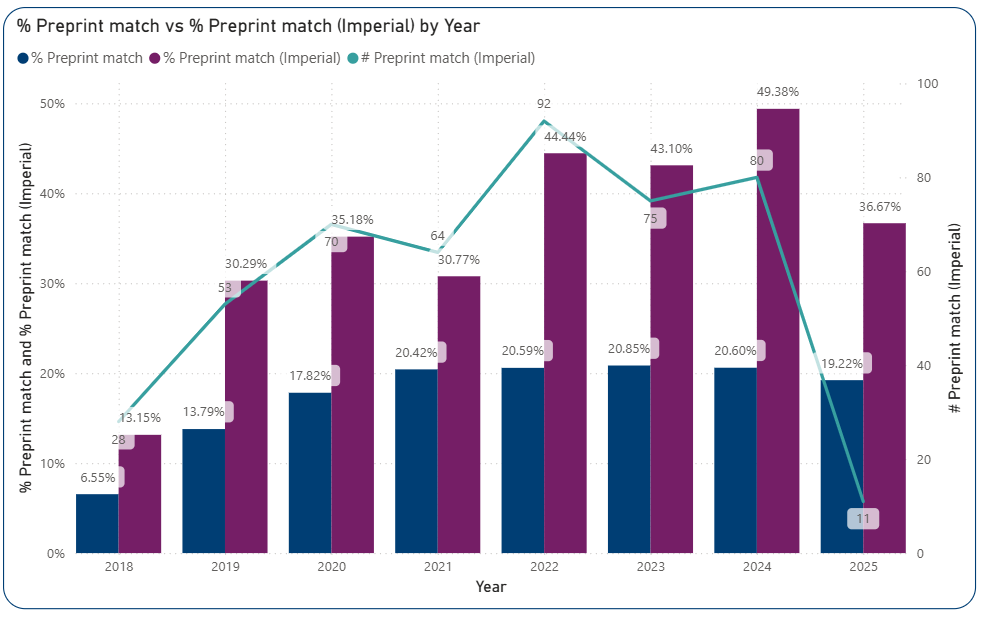
Posting preprints (non-peer-reviewed manuscripts posted to online servers before journal submission) has become a norm in many disciplines. Preprints improve research quality and increase visibility by enabling rapid dissemination and collaborative and timely feedback. It also a valuable indicator of bridge-building between research stages. Measuring how many publications originate from preprints can provide valuable insight into the adoption of open research practices. However, linking a preprint to its final published version can be challenging. The OSI dataset’s methodology promises to overcome this challenge.
35% of Imperial outputs in the PLOS dataset were associated with a preprint. Except for the incomplete year of 2025, preprint adoption has increased over recent years, jumping from 13% in 2018 to nearly 50% in 2024. The preprint match for Imperial publications is twice the global average in the PLOS set.
The latest version of the OSI dataset includes two new open research indicators: protocol and study registration. Although these two concepts have been incorporated in research process for some time, publishing and sharing them in outputs is relatively new. Implementing and sharing them is just as important as sharing data, as both are crucial for enhancing transparency and reproducibility, and ultimately for building trustworthiness in research.
Compared to other open research practices, the adoption of protocol sharing and study registration remains low. Only 10% of Imperial articles in the dataset included an available protocol and study registration, similar to the global average. The results here should be interpreted with caution since protocols are more common in certain fields than others.

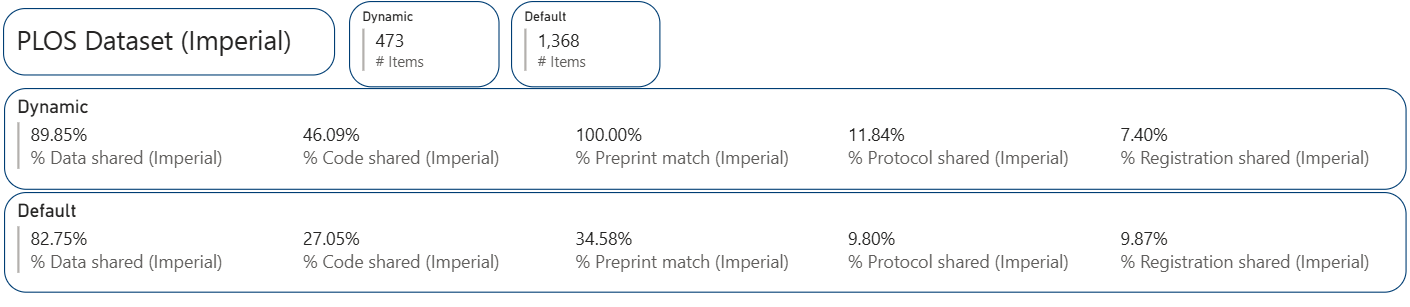
Do open research practices reinforce one another? The answer is yes.
Given the comprehensiveness of the PLOS dataset, it would be interesting to look at the relationship between the open research indicators. When considering the outputs that shared data, the percentage of all other open research indicators increases (e.g. code sharing rises from 25% to 32%, preprint match from 35% to 38%). The change becomes even more noticeable when focusing on publications that shared code. Among the Imperial articles that shared code, data-sharing jumped from 83% to 98% and preprint matching increased from 35% to 59%. The same pattern is true for preprints: outputs matching a preprint are significantly superior in adopting other open research indicators, especially data and code sharing.
Conclusion with reminding limitations and caveats
While the number of publications is significant, it only represents a tiny amount of the publication universe. The dataset includes open access outputs from one publisher that predominantly publishes in certain disciplines. Some fields, for instance, do not produce data as we understand it in the context of science. Also, preprinting may not be common where the journal article is not the main output type in some disciplines. It is also important to highlight that PLOS dataset puts journal articles in the centre and works backwards, meaning that we cannot confidently say whether open research practices were followed from the beginning of the research process or just at the time of publication. Generalising these conclusions to the entire research ecosystem without keeping the nuances in mind would be invalid and would risk creating gamification and perverse incentives in the same way that journal-based metrics have done for years. Despite its caveats, the PLOS Open Science Indicators dataset is a great starting point for measuring research in a more meaningful way, especially in the presence of unhealthy metrics. The analysis of the dataset gives us good insights into where we should focus our open research advocacy.
This brief analysis shows that while we seem to be in a strong position when it comes to sharing data, there is still room for improvement in other areas, such as sharing code, releasing preprints, making research protocols available, and registering studies before they begin, especially if they are underpinning elements of research. Everyone in this ecosystem, from researchers and institutions to funders and publishers, has a role to play in making this happen.