Category: Carbon Isotopes

Methane origins part III – the Relentless Rise of Methane

In Methane origins part two we pondered the methane plateau of the early noughties.  For part three the Sustinable gas Institute’s Dr Semra Bakkaloglu looks at what has happened since, and where the science points in figuring out the relentless rise in the concentration of methane in Earth’s atmosphere.


Methane concentrations are a two-way street. We know that the rise in the mole fraction (the measure of concentration in the atmosphere) for the gas can be attributed to two things; changes in the relative amounts and totals of emissions from biogenic, thermogenic, and pyrogenic sources, or its destruction through natural methane sinks – Nisbet et al., 2019.

So, which is it – is more being produced? Or is less being destroyed? It is an important question, because – as Nisbet et al also pointed out – the accelerating increase in concentration is enough to push us past Paris Agreement target limits.

Unfortunately, that’s not easy to answer – the Methane cycle (fig 1) is a complex thing.
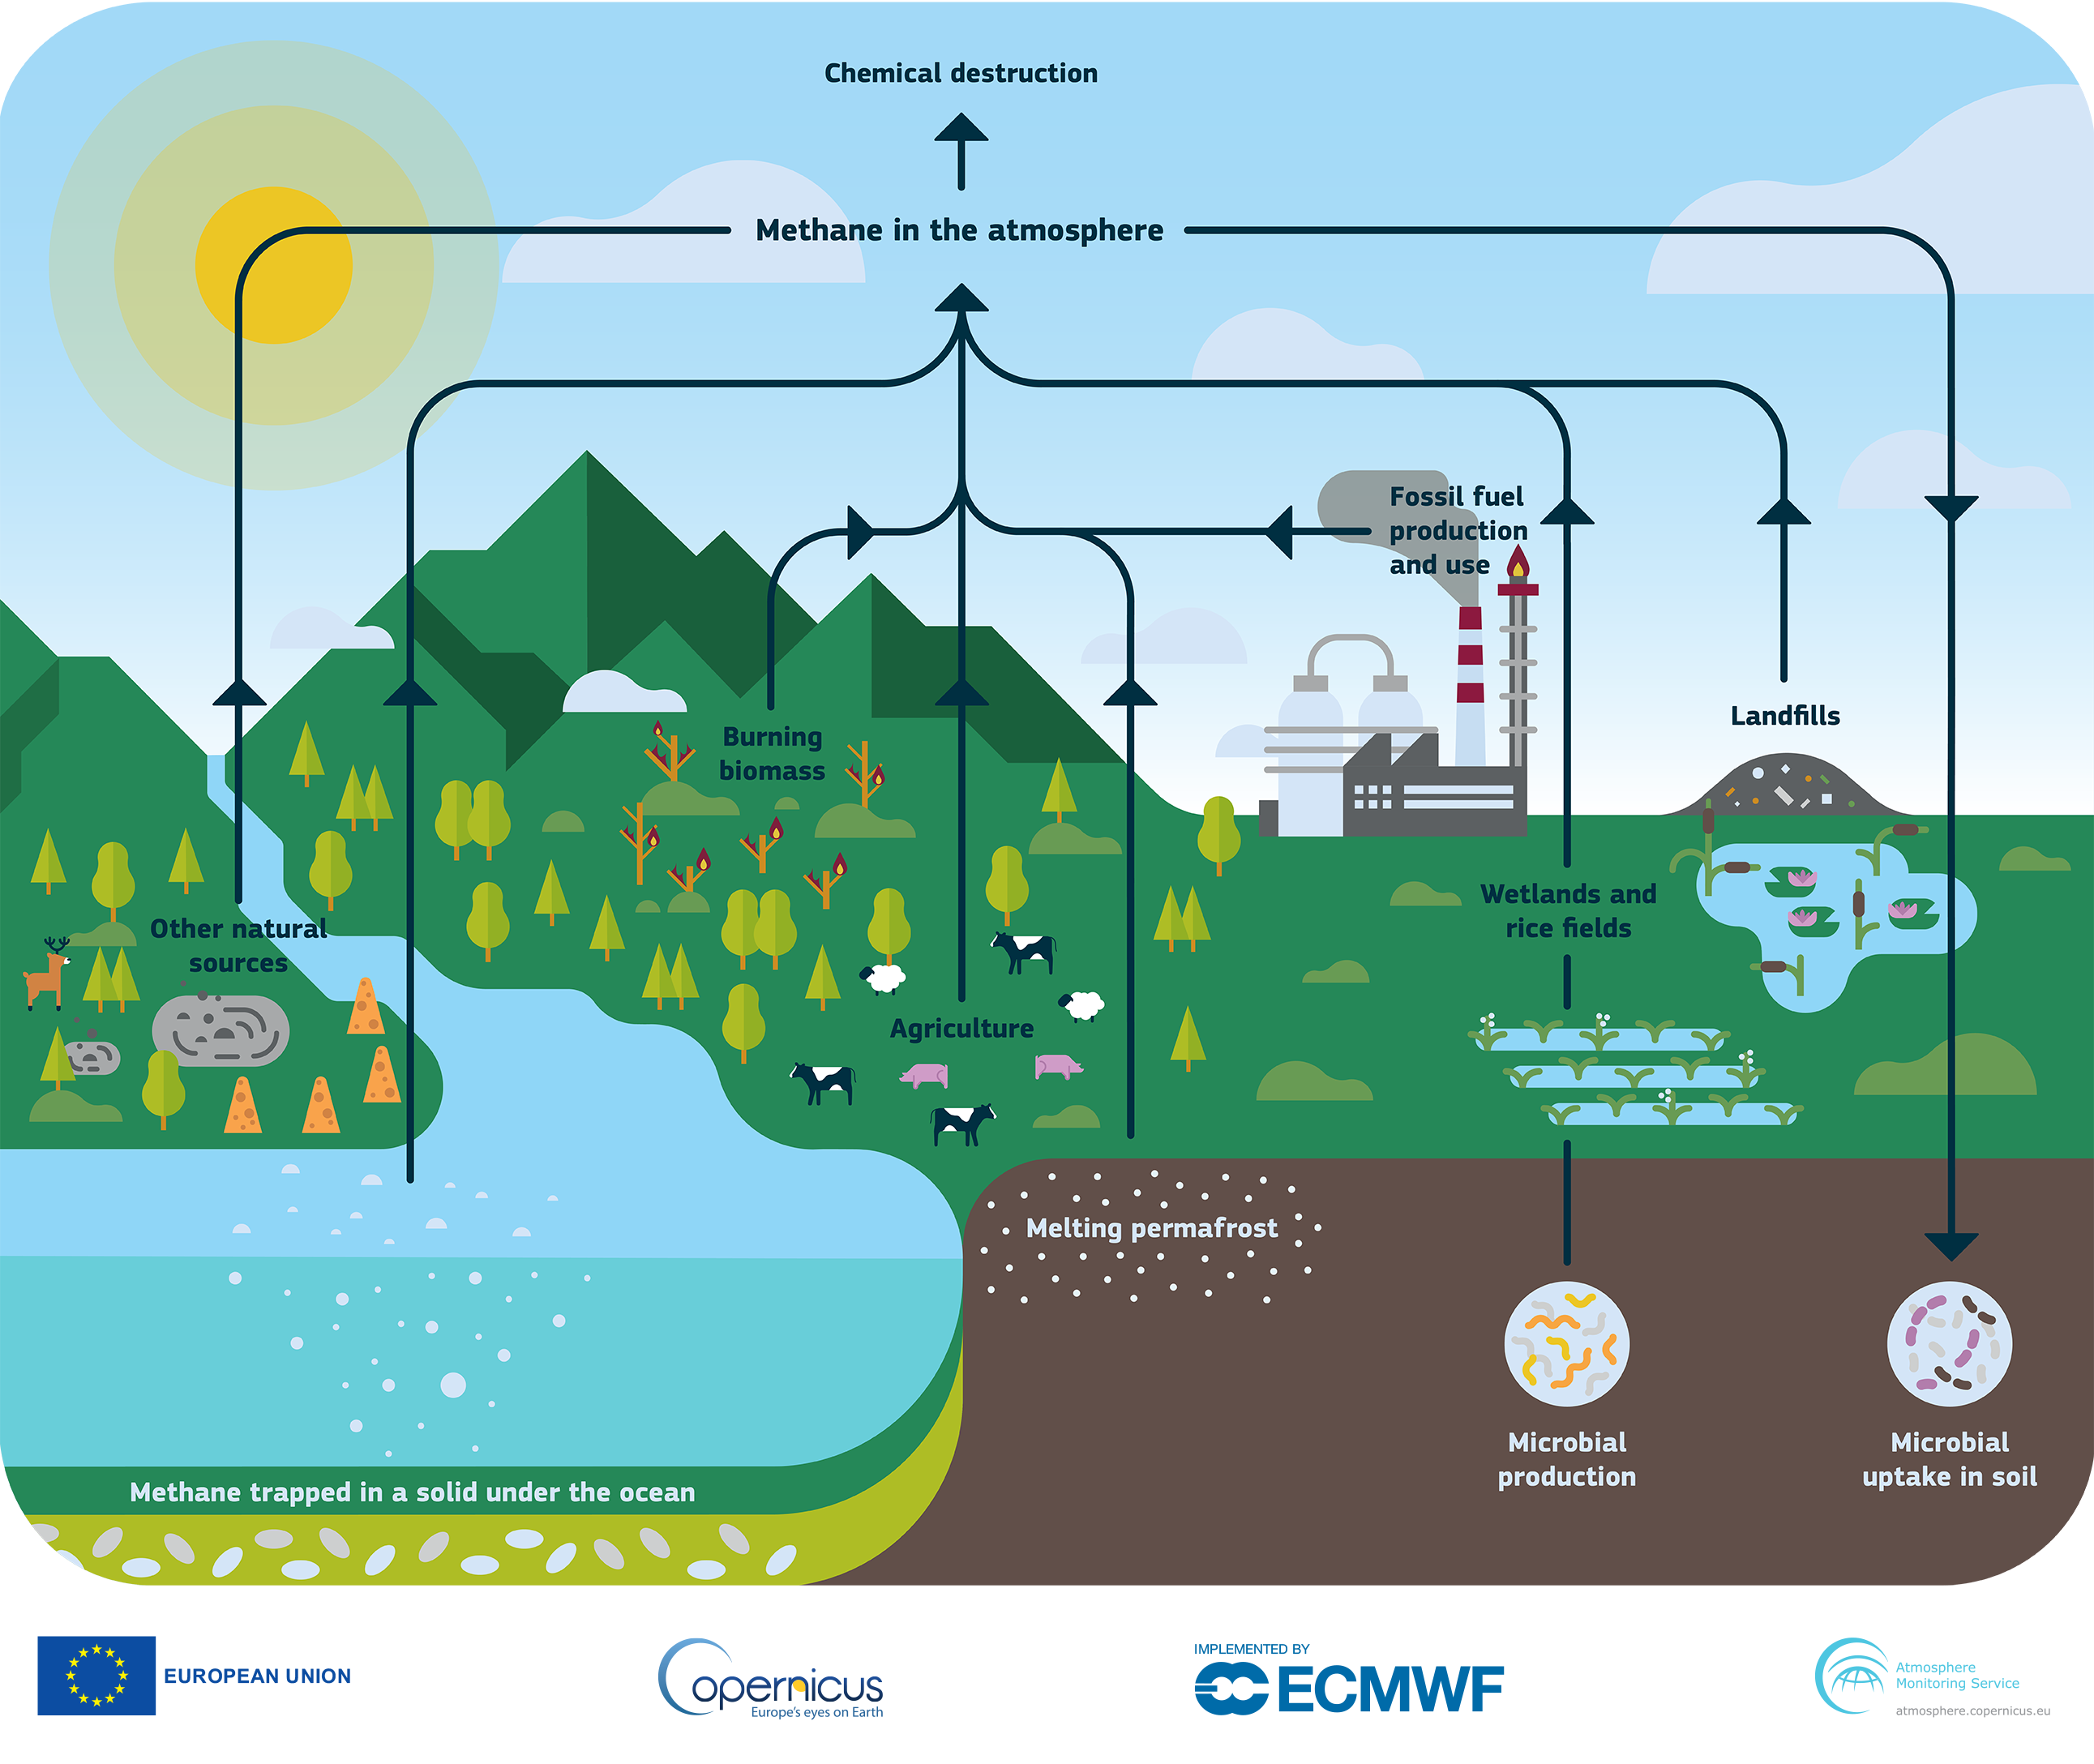
Fig 1: The methane cycle. Credit: Copernicus Atmosphere Monitoring Service, ECMWF.


So – remember part I? If you don’t, here’s a quick refresher on isotopic δ 13C – CH4 source signatures.  To better understand the methane origins –  the δ 13C – CH4 are defined as:

δ values are reported in per mille (‰), relative to the international standard materials Vienna Peedee Belemnite (VPDB) for δ13C.

So let’s investigate the research to see what scientists say about the increase in atmospheric methane concentration after 2006.

A 2022 study by Drinkwater et al examined satellite remote sensing data which suggested both – evidence of lighter atmospheric methane isotopic signature changes (which tend to indicate increasing natural emissions), coupled with a decrease in destructive rate via Hydroxyl radical (OH) sink mechanisms.

But in 2021 Zhang et al argue that anthropogenic emissions are responsible for atmospheric methane increases as current process-based wetland CH4 models cannot explain the fact that a significant rise in emissions from natural wetlands caused a decrease in atmospheric δ 13C – CH4 values.

If we are considering increasing anthropogenic emissions from biogenic sources, it is important to focus on livestock emissions since they are the largest source in the global methane budget. Research by Chang et al in 2019 suggests that ruminants’ enteric emissions played a larger role in the observed decline of δ13C in atmospheric methane from 2000 to 2012.

In my own paper, we examined waste source signatures and reported that the isotopic signature of CH4 – sourced from biogas plants and active landfills – exhibits more significant reductions in the 13C isotope compared to CH4 obtained from other waste sources.

We also know that governments are adopting the practice of diverting biowaste away from landfills towards anaerobic digestions, which is a beneficial strategy for mitigating methane emissions. These might explain the rise in CH4 mole fractions with a lighter isotopic signature.

So, what about the contribution of oil and gas emissions to increasing atmospheric methane levels? The methane isotopic signature being lighter suggests a decrease in oil and gas emissions. But recent International Energy Agency (IEA) data contradicts that. Methane emissions from the oil and gas sector have been increasing – so either the industry is getting very good at tackling supply-chain emissions, or we need to question whether we are missing something and investigate how the isotopic signature of methane from the oil and gas sector has been evolving.

A study in 2022 by Menoud et al supports that theory, reporting that the fossil fuel source signature could have been more depleted (more negative, lighter) in recent years.

Overall, it is evident that a great number of factors are responsible for the increase in atmospheric CH4 with a lighter isotopic signature. It is crucial to note that the atmospheric chemistry of methane is highly complex, and the main source of uncertainty when using δ13C data to distinguish between different methane sources, especially in methane sink mechanisms, as observed by Basu et al in 2022.

It is not going to be a clear-cut answer, but a plausible explanation includes the rise in emissions from agriculture and waste as well as fossil fuels with possible contributions from wetlands and a weakening sink. But we need significantly more observations to completely understand the global CH4 budget and key atmospheric processes in order to reduce the uncertainties associated with δ13C data in methane source differentiation.

Methane origins – part II: The millennium methane plateau and post-plateau rise

At the end of part 1, we touched upon how at the turn of the millennium and through the first half of the noughties, scientists working in emissions monitoring observed a plateau in what had been steadily increasing atmospheric methane concentrations. It was a phenomenon very much against the expected trend and the reasons behind it still generate scientific debate and controversy. So for part 2 of our methane origins story, Dr Semra Bakkaloglu turns ESI (Emissions Scene Investigator) to cast a magnifying glass over the evidence, and offers her perspective on what caused the plateau, and what’s been happening since


Since the beginning of the industrial revolution, the concentration of atmospheric methane has increased around threefoldWe know this from a variety of scientific research efforts, including analysis of air trapped in ice cores which can be mapped to specific time-frames and the establishment, since 1983, of modern sampling and monitoring programmes for atmospheric methane concentration. This accumulation of data has corroborated an upward trend that was largely unabatedThat was until 1999 when the increase abruptly stopped.

It wasn’t a short pause either. This plateau – where atmospheric methane concentrations more or less remained constant – went on for seven years. Only in 2006 was ‘normal service resumed’ and the relentless increase in concentration recommenced.

Fig 1 – CH4 trend: This graph shows globally-averaged, monthly mean atmospheric methane abundance determined from marine surface sites since 1983. (NOAA Global Monitoring Laboratory)

So was something, somewhere, absorbing the methane? Was it being degraded at a faster rate? Was it that we were producing less methane from anthropogenic sources such as agriculture or oil and gas production? Or had natural biogenic methane sources, for some reason, gone into decline?

The 7-year plateau and renewed growth since have been the subject of conflicting explanations in the literature.

Dlugokencky et al. (2003) suggest that the stabilisation may be a new steady state for atmospheric methane, and it is the renewed growth that is anomalous.

Others argue the increase in methane concentrations has continued for more than a decade, indicating that the plateau period from 1999 to 2006 could be seen as unusual (Turner et al. (2017)).

That leaves us with an intriguing question – which is the anomaly? The relentless growth since 2006 or the stable period of plateau.

So the focus of research should be on explaining the anomalous stabilisation period and identifying the sources of emissions that contribute to the continued rise of methane after stabilisation period. 

Scientists turned to carbon isotopes (which we explored in part 1) to try and understand exactly what had stopped the increasing concentration in its tracks. After all, if we can understand why, we might be able to put that to use in a technology that allows us to influence methane concentration levels.

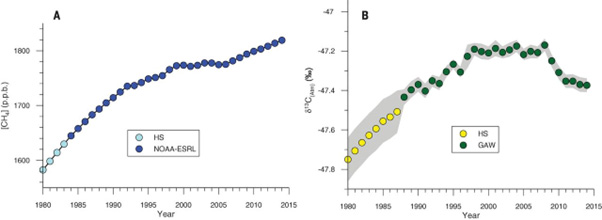
Let’s start with the isotopic ratios. We know that different proportions of carbon isotopes provide a signature for the source of methane. The pattern of 13C enrichment (less negative, heavier), along with a stable d13C, corresponds to the trends in methane concentration until the end of the 1999 and 2006 plateau (see Fig.2).

Fig 2. Global trends in methane mole fraction (A) and it isotopic signature (B) (Taken from Schaefar et al. (2016)

Post-plateau, there is an increase in the concentration of methane, accompanied by a depletion of 13C in the δ13C. This implies that the emissions before and after the plateau have different δ13C values.  

Various studies have suggested different explanations for the plateau in the 2000s and the growth of atmospheric methane since.

Decreased microbial methane production?
Kai et al. (2011) suggest that reduced growth rate can be explained by decreased microbial sources based on isotopic analysis.

A more active methane sink?
On the other hand, studies including methyl chloroform measurements indicate that changes in the methane sink played a role in both stabilisation and subsequent (Turner et al. 2017; McNorton et al. 2016). Turner et al. (2017) suggest that an explanation for the stabilisation is that the OH sink has increased, which has offset the increase in methane emissions.

A reduction in biomass burning?
Worden et al. (2017) used carbon monoxide measurements to suggest a decrease in biomass burning emissions (more enriched in 13C), which could explain the potential increase in both fossil fuel and microbial emissions.

A reduction in emissions from Oil and Gas?
Chen and Prinn et al. (2006) argue that fossil fuel sources decreased, a view backed up by Schaefar et al. (2016) 10 years later – that the plateau in methane levels can be attributed to reduced oil and gas production and investment into updating oil and gas infrastructure – largely a result of the collapse of the Soviet Union in 1992. This study qualified that  The plateau in methane  mole fraction could be due to variations in the hydroxyl methane sink alone, or it could be a combination of variations in the hydroxyl methane sink and reduced fossil fuel emissions.

There’s some important corroborating evidence here too; measurements of atmospheric ethane (almost solely a biproduct of the oil and gas sector) also showed a decline. Simpson et al. (2012) showed that global ethane emission rates declined from 1984 to 2010.

It can now be affirmed that the reduction in natural gas venting and flaring in oil fields contributed to this decrease, rather than a reduction in biofuel usage or biomass burning.

Chen and Prinn et al. (2006) reported an increase in emissions from rice and biomass burning, and suggested that a decrease in the energy sector could be the reason for the plateau. However, the evidence suggests that the reduction in fossil fuel emissions had a greater impact. It’s an observation that also clarifies why the isotopic signature remained unchanged during this interval – since rice emissions are depleted, and biomass burning emissions are more enriched than fossil fuel emissions.

Whilst isotopes are useful, the scientific toolkit for measuring slight and long-term changes in individual methane source strengths doesn’t yet allow us to accurately forecast future atmospheric methane levels with certainty.  New tools could help us improve our understanding in the sharp growth in methane concentrations since 2006 – and to examine that – you’ve guessed it – we’re going to need another blog!