Category: Gas innovation

How successful is the UK’s Net Zero strategy in the biowaste sector?

Greenhouse gas (GHG) emissions from the waste sector are primarily composed of methane (CH4) released from landfills. Biodegradable wastes such as food, garden waste, manure, paper and cardboard emit methane during anaerobic decomposition in landfills. In our latest blog, SGI emissions scientist Dr Semra Bakkaloglu explains some of the key findings from her newly published paper into emissions of CH4 from biowaste.

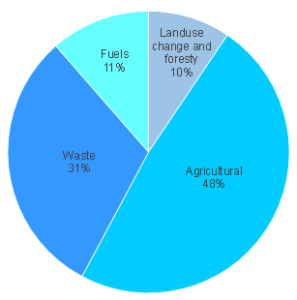
We know that CH4 is around 28 times more potent as a greenhouse gas than carbon dioxide (CO2) over a 100-year period (IPCC 2021). So, reducing CH4 emissions – from all sources – is critical to keeping global median temperature rise well below 2 degrees Celsius. In the UK, the waste sector is the second largest CH4 emitter after agriculture, so waste sector emissions deserve significant attention if we are to achieve the UK’s net zero targets.

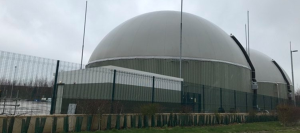
The UK biodegradable waste strategy aims to divert progressively more waste from landfills into anaerobic digestion or composting facilities for recycling. Recent studies (Gua et al. 2020, Bakkaloglu et al. 2022a, Cusworth et al. 2020) indicate that anaerobic digesters and composting facilities can be a significant source of CH4 emissions, and our latest study aims to evaluate the UK’s biowaste strategy to better understand future CH4 emissions.

We use the term biowaste in this study to cover food and garden waste, because the broader term – biodegradable – encompasses a wider variety of wastes such as manure, sewage sludge, paper, cardboard and more. The objectives for our research were to compare the environmental impacts of biowaste treatment in the UK and to assess the effect of CH4 emissions. We considered four different waste treatment methods anaerobic digestion, composting, incineration, and landfill), as well as seven different scenarios for waste in various ratios treated using current and future waste management technologies. Full details of those scenarios are explained in full paper.

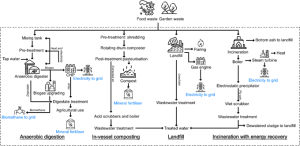
The four biowaste treatment methods assessed: anaerobic digestion; in-vessel composting; landfill; incineration with energy recovery. The dashed line indicates the system boundary and blue text indicates recovered resources.

In our latest study, we combined mobile CH4 emissions data for anaerobic digesters (AD) – rather than relying on the default emission factors for life cycle assessment (LCA). Approximately 19% of biowaste in the UK is currently landfilled, while 38% is incinerated. Of the remaining 53%, the waste strategy set a target for AD of 15% in 2020.  It is reasonable to assume that 15% of biowaste is sent to AD and the remaining 28% is sent to the composting facility. Combining the mobile methane emissions from AD and composting facilities, we can estimate that current annual UK average methane emissions are approximately 58.2 kilotonnes.

If we sent 90% of biowaste to AD and 1% to landfills as a strategy for the reducing landfilled biowaste by 2050, annual emissions would decrease to 30.3 kilotonnes. Therefore, sending more biowaste to AD can reduce emissions, but if we want to achieve net zero emissions from the waste sector, remaining emissions must be offset. Therefore, we recommend that future UK waste management policies should also focus on eliminating fugitive emissions from treatment technologies, especially AD, in order to achieve net zero emissions by 2050.

Biogas and biomethane emissions – a quick win for decarbonising future energy systems?

In our latest blog, Dr Semra Bakkaloglu reflects on our newly published research into biogas and biomethane emissions.

Over 100 years, methane has 27.2 times the global warming potential of carbon dioxide. So when it comes to climate change, it’s pretty potent stuff. Methane concentrations in the atmosphere are increasing, which makes it a quick-win target in the drive to decarbonise our global energy system.

It’s no coincidence that over 100 countries signed the Global Methane Pledge at COP26 in Glasgow. The pledge is a commitment to reduce methane emissions by 30% (from 2020 levels) by 2030. But a 30% reduction is ambitious, not to mention a complete reversal of the current trajectory of increasing methane emissions. Achieving that will require a combination of measures, which include reducing emissions from the existing supply chain whilst also reducing reliance on natural gas as a fuel by switching to cleaner energy alternatives, such as electrification or hydrogen.

But those new energy alternatives are at wildly different stages of technological readiness and require major infrastructure changes and investment. They are unlikely to happen overnight – and many are unlikely to become mainstream within the next 8 years.

One sector that is expected to grow and contribute to decarbonisation in that transition period is biogas and biomethane – a mixture of gases (mostly methane (CH4 and carbon dioxide (CO2)) produced from biodegradable materials. It’s a technology with a lot of factors in its favour: the volume of organic waste – known as feedstock – generated by modern societies is increasing, it provides a beneficial alternative disposal method for that waste, and conversion of energy from waste to biogas can begin to replace fossil fuel gas – which in turn reduces overall greenhouse gas (GHG) emissions. Ultimately it contributes to meeting those government commitments.

But biogas and biomethane production can also emit methane and it’s an area that’s been lacking in research. No study has assessed methane emissions from the biogas and biomethane supply chain – until now.

For our recent study, we synthesised methane emissions from the biogas and biomethane supply chains by breaking down stages and identifying key elements from direct measurements studies. We used a statistical model Monte Carlo approach to estimate aggregate methane emissions with uncertainty assessment, which can account for up to 343 g CO2-eq. We observed that biogas and biomethane supply chains exhibit similar emission characteristics to oil and natural gas with super-emitters present at all stages. In our study, 62% of the emissions come from just 5% of the point sources – these super-emitters waste a disproportionately large amount of methane

“..62% of the emissions come from just 5% of the point sources – these super-emitters waste a disproportionately large amount of methane.”

The International Energy Agency’s (IEA) inventory, (the only other benchmark data currently available) estimated total methane emissions from bioenergy to be 9.1 Tg in 2021.

Our study, which only looked at one aspect of bioenergy (biomethane), discovered that methane emissions are more likely to be in the range of 6.4 – 7.8 Tg per year (95th percentile), but the average methane emissions are around 2.8 Tg according to the IEA’s global biogas and biomethane generation rate 1.47 EJ in 2018. If biogas and biomethane production are expanded to the same scale as the oil and natural gas industries and no action is taken, they could emit almost 4 times as much methane as oil and gas supply chains (82.5 Tg in 2021). At present, our results indicate they are high – higher even than natural gas, which is clearly a worry.

Considering the latest IPCC-AR6-WG3 climate change mitigation scenarios that achieve the Paris Agreement 1.5°C temperature rise mitigation target with low or no overshoot, we can see that biogas and methane could have up to 28 EJ of production by 2050. Using our mean emissions rate (52.3 g CO2-eq per MJHHV) from this study, this would result in 53.8 Tg methane emissions. This drives home the point that it is extremely important to reduce biogas and biomethane emissions for these energy sources to play a constructive role in our future energy system.

Finding and removing these large emitters is a critical step toward significantly reducing overall emissions from biomethane and natural gas supply chains. It’s not just about controlling greenhouse gases either. There’s a significant economic argument for addressing emissions – all that lost gas has a commercial value.

According to the European Biogas Association (EBA), biomethane can be produced for as little as €55 per MWh, while natural gas costs around €80 per MWh. When our findings are combined with the cost of biomethane, we can calculate that emitting 2.8 Tg of methane per year in average (based on the IEA’s global biomethane and biogas generation rate for 2018) can result in an average a global economic loss of 2.4 billion euros in average.

“… emitting 2.8 Tg of methane per year can result in a global economic loss of €2.4billion in average.”

Through improved design, detection, measurement, and repair techniques, much of the observed emissions can be avoided. If we focus on super-emitters, there are some potential quick wins too. We found that the digestate stage and upgrading units need the most attention in this regard. There’s a lot of overlap with oil and natural gas supply chains too – preventing gas venting, reducing flaring activities and designing a closed unit with a vapour recovery system can all contribute to reducing emissions.

Additionally, we need better regulations, continuous emission measurements, and close collaboration with biogas plant operators in order to address methane emissions and meet the Paris Agreement temperature target.

We know what we need to do to tackle those emissions; the important thing is to get started right away. Biomethane is an important renewable energy source, but it could be even better! Combating biomethane emissions is not only significant for meeting Paris Agreement’s target but also boosting the global economy.

Does gas hold a future with the Paris climate targets?

FaceLeonie Marie Emilie Orhan is a student on the MSc Sustainable Energy Futures course at Imperial College. She previously did her undergraduate at the University of Warwick in Mechanical Engineering. Leonie wrote a summary blog post about the latest white paper, ‘Best uses of natural gas within climate targets’ and launch event.

The sixth white paper from the Sustainable Gas Institute ‘Best uses of natural gas within climate targets’ focuses on the future uses of natural gas within the 1.5°C Paris climate targets for both 2050 and 2100. Through the analysis of different gas use scenarios (and energy mixes) from the Intergovernmental Panel on Climate Change (IPCC), it highlights the uncertainties in the future use of natural gas and highlights the potentials of Carbon Capturing and Storage (CCS) and of hydrogen in decarbonisation. It also focuses on the impact policies have on the development and growth of these industries through investment attractivity.

The presentation (watch the launch video) was hosted by the author, Dr Jamie Speirs, a Research Fellow at the Sustainable Gas Institute and the Centre for Environmental Policy, and co-authors, Luke Dubey, a Research Assistant at the Sustainable Gas Institute, and Naveed Tariq, a PhD Researcher from the Department of Chemical Engineering at Imperial College London.

Gas use differs across regions

It is evident that natural gas usage must be reduced not only to attain the 1.5°C targets, but also to conserve fossil fuel reserves for applications which do not yet have viable substitutions. A large majority of the scenarios agree with this, with large variations in different regions. The report shows that Europe’s consumption is set to drop rapidly through substitutions to greener solutions, while in Asia, natural gas would increase until 2050 (before decreasing) due to a growing middle class which relies on affordable energies. I found that highlighting these differences brought light to the individuality of solutions required if they are to consider not only the environmental perspective, but also the social and economic facets.
The importance of carbon capture and storage


Natural gas use was also shown to decrease significantly faster without carbon capture and storage (CCS) than with CCS. This demonstrates that to meet the 1.5°C targets while allowing a more significant transition period to other more sustainable energies, CCS must develop quickly. However, CCS development is controlled by economic incentives and policies as these are needed to be in place to draw in investments to enable the growth of the CCS industry.

Natural gas and hydrogen

In sectors for which decarbonisation is more difficult, such as domestic heating or transport, hydrogen could provide a substitute for the use of natural gas. Currently, hydrogen can be separated into blue and green hydrogen: blue hydrogen is produced using natural gas and green hydrogen using renewable energies. Due to the high costs of green hydrogen production, blue hydrogen is currently more favourable to the economy. Although its production does contribute to greenhouse gas emissions, its growth is necessary to pave the way for green hydrogen. This is due to the infrastructure needs of hydrogen production, storage, and distribution.

The UK government has stated in its recent Hydrogen strategy that both CCS and hydrogen will be essential to decarbonisations with notable milestones based on an increase in hydrogen production (1GW by 2025 and 5GW by 2030), an increase in CCUS clusters (2 by 2025 and 4 by 2030) and hydrogen heating and hydrogen town trials in 2025 and 2030. This shows a\strong interest from the government in these economies, as the UK seeks to transition quickly to enable a strong economic growth.

The White Paper points out that the scenarios analysed are based on the current knowledge of greenhouse gas emissions, which lacks an understanding of methane global warming potentials and may be affected by other factors in the future. This points out the need for a regular analysis and updated predictions and shows that there could be discrepancies between the scenarios presented and the future.

One of the main points I feel was conveyed in the report and presentation was the lack of policies to incentivise the growth of CCS and hydrogen production, which have the potential to play large roles in reaching the 1.5°C targets. Policies would need to centre around the development of the infrastructures required, the realignment market regulations to meet the demands of CCS and hydrogen, and agreements for international trade of hydrogen.The differences in hydrogen demand depending on how strong policies were really illustrated these points, with few and weak policies resulting in a demand over three times smaller than for strong ones, while with policies whose strengths and numbers are at a theoretical maximum, the demand came close to twice that of strong policies.

Expert views on the report

Dr Susana Moreira, a Senior Gas Specialist at The World Bank, offered a commentary which outlined the importance of investing in more electricity grids to cope with the demand and ease the changes in economy required to pave the way to a net zero future. Another pertinent point was that of connecting everyone to the grid and the adjustment that gas producing countries would have to make, not only to their electricity structures, but also to their economies. The impact of hydrogen production to the environment and communities was also pointed out. Overall, her commentary brought light on economic, social, and environmental issues which are key factors in the consideration of a net zero future.

Martin Lambert, a Senior Research Fellow at the Oxford Institute for Energy Studies, focused his commentary on emphasising the need of investments and policies required to do so.

Overall, the paper shows that to meet the 1.5°C targets, CCS and hydrogen must benefit from policies to encourage investments and regulations to direct the market as meeting the targets requires reliance on CCS and hydrogen. I feel more emphasis should have been placed on the idea that although the population is projected to increase to over 10 billion by 2100 (UN Population Facts, December 2019) natural gas usage is predicted to decline.