Category: Uncategorised

A Pathway to Sustainability


It’s Sustainability Week at Imperial. So what better time to spotlight the brilliant work of the Sustainable Gas Institute’s Dr Jasmin Cooper.

On top of her day job – making a significant contribution to the scientific community’s understanding of greenhouse gas (GHG) emissions – Jasmin is also a member of the Department of Chemical Engineering’s (DoCE) sustainability committee. We caught up with Jasmin to find out more about what her role on the committee entails and how she her scientific skillset is playing a pivotal role in progressing Imperial’s sustainability ambitions.


There’s little disputing the scientific evidence that climate change is one of the greatest challenges facing human civilisation this century.  We’re already seeing consequences globally. 2022’s floods in Pakistan and the big Christmas freeze in North America are just two of a growing list of recent events. Weather attribution (being able to prove the link between climate change and extreme weather such as heatwaves, droughts, floods and super-storms) is a growing field in itself that Imperial scientists are involved in.  But when it comes to tackling the root causes, there’s an area of expertise that’s in at the beginning – Life Cycle Assessment (LCA).

The biggest challenge in changing human behaviour is that the causes of climate change – anthropologically generated greenhouse gases (GHGs) – are, a seemingly invisible threat. To cut GHG emissions, we need to better understand how much is produced and where they come from. Our sustainability committee is focused on doing that for DoCE operations.

Imperial’s Department of Chemical Engineering set up its sustainability committee in 2021. It’s part of a college-wide strategy to improve environmental sustainability across all of Imperial’s estate, both through efficiency and innovation – with the holy grail of achieving carbon neutrality by 2040.

A robust scientific technique for quantifying these emissions is Life Cycle Assessment (LCA).  As we work, rest and play there’s a life cycle for everything we interact with.  From the emissions impact of growing and processing the food we eat to the footprint of manufacture, usage and scrapping of the vehicles we drive – even the bikes we cycle and the streaming content we binge – everything has a carbon footprint.

Obtaining baseline data to quantify carbon emissions requires significant interdepartmental cooperation – with departmental operations, Imperial’s estates, ICT and campus services teams – and of course our student and academic population. So it’s as much an exercise in collaboration as it is scientific analysis

Once the carbon footprinting is done, across all of DoCE’s activities and building assets we move forward to the LCA.  We’re then able to make assessments on where we can make changes to each pathway to reduce our emissions impact – hopefully to Net Zero by 2040.

In the meantime, if you want to help right away – here are some energy-saving tips from the sustainability committee.


BOOK REVIEW: The New Map, by Daniel Yergin

By Pooya Hoseinpoori, Research Assistant, SGI

The global energy landscape has changed dramatically over the last decade. Three macro trends have reshaped the energy market and the global energy map over the past decade: the shale boom in the US, the growing role of renewable energy, and the rise of climate policies and government funding. Daniel Yergin, a veteran energy analyst, explores the new energy maps emerging from these changes in his latest book, “The New Map, Energy, Climate, and the Clash of Nations”. The global energy map has changed significantly since Mr Yergin published “The Quest” in 2011. In the New MAP, he updates and expands his analysis of technological advances, energy and geopolitical changes and presents a compelling narrative of developments that have disrupted the energy world over the past decade.

The New Map opens with the new US map and the shale revolution, which raised the supply and lowered the price of oil and gas, and reshaped traditional oil and gas relations and geopolitics by changing the US’s position on the global energy market. Next is Russia’s map shaped by geopolitical competition and conflicts over un­resolved borders from the collapse of the Soviet Union as well as a pivot to the east strategy and alliance with China. Then there is the new China map with its massive, ambitious international investment strategy known as the Belt and Road Initiative and its strategic plans for securing its commodity trade flows across the South China Sea. The Middle east’s map comes next in the book, formed by frontiers and rivalries and an economy highly dependent on oil and gas revenues. Last is the roadmap of the future and the climate maps discussing how the transition to a low carbon energy system might play out.

Like his previous books, the New MAP is full of detailed stories and interesting statistics about changes and events that formed these new maps: “By 2019 the unconventional revolution (shale boom) was supporting over 2.8 million jobs in the US”, “The US trade deficit in 2019 was 309 billion lower than it would have been if there was no shale revolution”, “China is building eight new airports a year”, “In 2019, $25 million cars were sold in China”, “Between 2006 and 2013 China’s gas consumption tripled” and also stories on Russia’s pivoting to east strategy and the new level of cooperation between China and Russia: “At the same time president Putin and president Xi were making pancakes together, their military joined in a large war game in the Far East”, “Chinese would provide the financing for a massive new $45 billion power of Siberia gas pipeline”, “Russia’s $25 billion investment on ESPO oil pipeline facilitated by $80 billion prepayment China made to Rosneft for deliveries over the next twenty five years”. Through all these statistics and stories, Mr Yergin sets the context for his contention that oil and gas will continue to be part of the ongoing energy mix, and their role remains a central theme of global energy order in the upcoming decades.

Yergin does not doubt climate change or question the transition to green energy. In his book, he discusses the substantial progress made in renewable energy and suggests that the use of wind and solar power will continue to grow despite the obstacles still standing in their way. He also provides a thorough history of the electric car (which I really enjoyed) and suggests that EVs will become commonplace and that governments will impose greater restrictions on fossil fuel use to combat climate change. He acknowledges that a change like this will eventually occur. But he believes that energy transformation is a gradual process that will take a very long time, and he is unconvinced that this will occur at the ambitious rates promised by net-zero targets. In his opinion, climate change concerns are not yet strong enough to majorly alter geopolitical orders or reshape development plans.

The New Map has been met with mixed reactions and responses, with the majority of critiques being directed at Yergin’s stance on energy transition. While some criticised him for being “so embedded in old patterns of thought that he can’t quite recognise the urgency of the climate crisis”, in the eyes of some, “he is injecting reality into expectations of the energy transition”. I share Yergin’s doubts about optimistic transition rates and very ambitious net-zero targets. My critique, however, goes to other chapters in which I found his perspectives US-centric and also primarily focused on oil and gas producing countries, with China being the only big demand centre discussed. I was hoping to read more about developing countries and new MAPs for Africa, India, or South America. Overall though, in my opinion, the New Map is timely and a fitting follow-up to his previous books “The Quest” and “The Prize”.

Ref 1) https://eandt.theiet.org/content/articles/2020/10/book-review-the-new-map-by-daniel-yergin/

Ref 2) https://www.independent.co.uk/arts-entertainment/books/daniel-yergin-bill-mckibben-new-map-book-review-energy-oil-climate-crisis-b672002.html

Ref 3) https://www.pressreader.com/usa/usa-today internationaledition/20200917/281848646024355

Ref 4) https://www.youtube.com/watch?v=Ye1EIY2p-wo

Ref 5) “The New Map, Energy, Climate, and the Clash of Nations”, Daniel Yergin, Penguin Press 2020


BOOK REVIEW: “Sustainability for the Rest of Us: Your No-Bullsh*t, Five-Point Plan for Saving the Planet” by John Pabon

By Zara Qadir, Communications Manager

“Sustainability for the Rest of Us: Your No-Bullsh*t, Five-Point Plan for Saving the Planet” by John Pabon is a short book (just 200 pages) and a definite page-turner for those who want to delve beyond the hype. The book makes you think critically about sustainability (‘as not all giving is equal’) as well as providing a simple plan and crash course guide to sustainability terminology. Pabon talks about how to spot greenwashing and how often philanthropy is misplaced by those who are well-meaning. However, he also highlights projects that have had a real positive impact on communities and the environment.

Pabon describes himself as a pragmatic altruist, and tells us that ‘passion, without pragmatism, is just complaining’. His book is a witty, bold, and refreshing read that makes you feel uncomfortable sometimes. However, his overall advice is solid with a strong background in sustainability at organizations such as United Nations, McKinsey, A.C. Nielsen.

When volunteering your time, he recommends looking at donating your professional skills in an ongoing way where it is needed most. We’ve got to focus on what we can do and not try to do everything at once, so we don’t burn out. He also says it is useful to think like a marketer, not an activist. By this, Pabon means identifying your stakeholders and working with them to find out what the best long-term solution is. The afterword focuses on the impact of Covid-19 and highlights some positive developments, for example, an unprecedented and significant reduction (although short-term) in greenhouse gas emissions across the globe.

Cutting methane in the EU energy sector- is the new Regulation doing enough to tackle emissions?

By Dr Jasmin Cooper, Research Associate, Sustainable Gas Institute

Since 2020 the EU has been proactive in its approach to tacking methane emissions and in October 2020, the Commission published its Methane Strategy (European Commission, 2020), which outlined the Commission’s goal of cutting emissions by 35-37% by 2030 (relative to 2005) across Member States. In October 2021, the EU co-launched the Global Methane Pledge (European Commission, 2021a) and in December 2021 the European Commission released their framework on how to tackle methane emissions in the energy sector (European Commission, 2021b). This framework outlines the Commissions legislative approach for how cuts to methane emissions are to be made, and how to ensure all Member States achieve the necessary cuts. The Regulation introduced addresses methane from oil and gas and coal but emissions from biomass are not included. It aims to develop a union-wide framework that is homogenous in its approach and standards, with a large focus on transparency in emissions reporting and verification. To cut methane emissions, the Regulation focuses on improving emissions monitoring and reporting, eliminating venting and flaring and establishing minimum standards in leak detection and repair.

Improve accuracy and transparency in emissions reporting

The Regulation outlines the rules on how methane emissions from oil, gas and coal production, storage, transport and distribution within the EU’s borders are to be accurately measured, reported and verified. To ensure operators are implementing the measures set out in the Regulation, each Member State must appoint at least one competent authority to oversee compliance with the Regulation. To verify emissions, independently accredited verified will review the emissions reports submitted by the operators and ensure these follow the requirements set out in the Regulation. The International Methane Emissions Observatory will be given a verification role in emissions data and the information produced will be made available to the public and the Commission.

Actions to cut emissions in the oil and gas sector

The Regulation specifies that upon entry of the Regulation, operators must submit emissions reports for all of their operated and non-operated assets on an annual basis. The first report gives source level emission estimates estimated using emission factors. In subsequent reports, emissions are estimated using direct measurement methods with emissions verification by site-level emissions measurements.

To mitigate methane emissions in oil and gas, the Regulation sets out specific rules for leak detection and repair (LDAR), venting and flaring:

 Leak detection and repair

Within three months of entry of the Regulation, operators need to submit their LDAR programme, which outlines the surveys to be carried out. By month six of entry of the Regulation, all relevant components an operator is responsibility for must have been surveyed. In the surveys, a leak is defined as 500 ppm methane and all components found to emit this amount or more must be repaired or replaced immediately, or as soon as possible (but no later than five days after detection).

Limits to venting and flaring

Under the Regulation, both venting and flare are banned except under specific circumstances e.g. emergencies and malfunctions. Flaring is preferred over venting, but only when re-injection, on site utilisation or entry into a gas market is not possible for non-economic reasons. If an operator wishes to vent or flare gas, they must demonstrate that venting or flaring is necessary and must notify the necessary authorities of any venting and flaring event within 48 hours of the event initiating.

Actions to cut emission in the coal sector

To tackle methane emissions from coal mines, an approach similar to oil and gas is outlined. Specifically, the Regulation focuses on ventilation shafts in underground mines, drainage systems and open coal mines. The Regulation largely focuses on improving emissions measurement and monitoring but also prohibits venting and flaring in mines, except for emergencies. For abandoned coal mines, operators are required to measure and monitor emissions from all abandoned and closed coal mines and to report the emission measured on a yearly basis.

Addressing emissions from outside the EU’s borders

The Regulation has a large focus on transparency in emissions data but states that the Union is committed to working with exporting countries to tackle methane. To improve transparency, countries who supply fossil fuels to EU Member States are required to provide the Member State with data on methane emissions: emissions measurements, reporting and what emission abatement measures are being carried out. To aid in improving transparency in emissions data, exporting countries will be incentivised to sign up to international partnerships and coalitions that aim to cut methane emissions, such as OGMP 2.0. The Commission will assess the submitted information on data quality and detail of monitoring, reporting and emissions verification applied by the exporting country. This data will use used to create a methane transparency database, which will be made available to the public for free.

In addition to this database, the Commission will also establish a global methane monitoring tool, using satellite data and emissions data provided by operators. This tool will also be made available to the public and will be used to provide information and updates on the magnitude, occurrence and location of high methane emitting sources.

Does it go far enough?

Following on from the EU Methane Strategy, it is good to see the Commission lay out clear rules for how methane emissions are to be cut. However, while it does tackle key areas in methane abatement such as emissions data quality and accuracy, there are areas which are lacking and could be improved upon revisions to the Regulation:

  • The Regulation does not outline technologies to be used in emissions monitoring, particularly in LDAR and instead chooses to allow Member States flexibility such that LDAR technologies can be innovated and developed.
  • Emissions from coal outside of mining are not included. Methane can also be emitted during coal waste management, handling, processing and transportation.
  • It does not specify penalties to Member States or operators who fail to meet the obligations outlined, and individual Member States are to lay down their rules on penalties. However, the Regulation does specify that penalties must be effective, proportionate and dissuasive.
  • The Regulation could go further in applying pressure to fossil fuel exporters. It does not specify actions for exporters whose emissions and reporting standards are not on par with what is to be expected.

References

European Commission 2020. COMMUNICATION FROM THE COMMISSION TO THE EUROPEAN PARLIAMENT, THE COUNCIL, THE EUROPEAN ECONOMIC AND SOCIAL COMMITTEE AND THE COMMITTEE OF THE REGIONS on an EU strategy to reduce methane emissions. Brussels, BE: European Commission

European Commission. 2021a. Launch by United States, the European Union, and Partners of the Global Methane Pledge to Keep 1.5C Within Reach [Press Release]. Brussels, BE. Available: https://ec.europa.eu/commission/presscorner/detail/en/statement_21_5766.

European Commission 2021b. Proposal for a REGULATION OF THE EUROPEAN PARLIAMENT AND OF THE COUNCIL on methane emissions reduction in the energy sector and amending Regulation (EU) 2019/942

COM/2021/805 final. Brussels, BE: European Commission


Future Heat for Everyone and the Role of Hydrogen

By Ellie Martin

The 2021 Sustainable Gas Institute Annual Lecture was delivered on 3 December and focused on hydrogen’s role in heating. It was contextualized by the challenges to decarbonizing heat, a comparison of hydrogen boilers and heat pumps, the importance of listening to consumers, and the steps that need to be taken to achieve net-zero gas with the help of hydrogen. Content was delivered by the engaging Dr. Angela Needle, who serves as strategy director at Cadent Gas, founder of the Women’s Utility Network, and VP of the Hydrogen UK Trade Association.

Challenges to Gas Alternatives

Given the impending state of climate change and a 300 TWh yearly dependence on natural gas for domestic heating, it is clear that decarbonizing gas is key to achieving net zero emissions for the UK by 2050. Fortunately, a few alternatives to natural gas are inching across the market – namely heat pumps, district heating, and now potentially hydrogen. Current gas boilers are reliable, easily tucked into cupboards and other discrete areas, easy to control and adjust, and generally problem-free. These are some big shoes to fill. What’s more, over £11,000 per home would be needed to cover the energy efficiency improvements, appliance replacements, and electricity and gas network changes necessary for net zero gas. On top of this, homes in the UK are quite literally the worst in Europe when it comes to retaining heat. UK homes lose an average of 3°C over five hours (surpassing all European neighbors), with 61% of EPC ratings falling at or below the D level.

There’s also the difficulty of determining who owns buildings, with the UK moving towards outright ownership. This is a huge challenge to achieving net zero because homeowners are the hardest to reach when it comes to government policy. Diversity in ownership types also presents an issue: solutions will need to be tailored to each property instead of adopting a one-size-fits-all policy.

Dr Angela Needle

Heat Pumps vs. Hydrogen Boilers

An all-hands-on-deck approach will likely be required for natural gas replacements, particularly during the early stages of development when it is unclear which technology will turn out to be the best investment. While hydrogen boilers and heat pumps are often unfairly pitted against each other, there are some key differences between the two that bear mentioning.

One of the most obvious advantages to heat pumps is that they’re currently deployable and proven to work. They’re also highly efficient and thus a good fit for well-insulated homes, and the low energy requirements afforded by these high efficiencies can produce lower running costs. Downsides to this technology include its high upfront cost, supply chain limitations, and the need for consumers to change their behavior.

On the flip side, hydrogen boilers are expected to cost around the same amount as gas boilers and could fit in the same exact spaces, and thus the switch would require less adaptation by consumers. They don’t need to rely on electricity at critical times of the day due to the capacity for storage, and they don’t produce any carbon monoxide. However, hydrogen boilers are not yet commercially available and could temporarily increase gas prices during the initial scale-up stages. Another issue is public perception, namely safety concerns regarding flammability and a general view that these systems are inefficient because energy is required to make hydrogen, and hydrogen is required to make heat.

Since the two options excel in different areas, one technology might be a better fit for a given context. For this reason, it is important to approach deployment from an individual building level in addition to a national level. Resilience network planning will also be key to ensuring constant delivery, even in extreme circumstances like disruptive storms.

The Importance of Consumers

Decarbonizing gas is going to require a highly inclusive approach that considers technical, economic, and consumer perspectives. This last bit is especially important, as consumers tend to be left by the wayside when it comes to big picture solutions. And despite reports that 75% of the public is concerned about climate change, there is still a massive gap between public intent and public action – for example, only 39% of people have reported considering a switch from natural gas heating. Because the effort required to implement new technologies can be a major barrier to uptake, it is crucial for governments to make it easy for consumers to commit to action. A key part of this involves educating consumers with the help of trusted advisors, such as local tradespersons and NGOs, as opposed to energy suppliers or natural gas companies (for whom consumers are typically much less responsive).

Planning the Future

 Cadent is working on a range of projects related to net zero gas, and I was particularly impressed by their implementation approach, which is essentially this: don’t expect people to be comfortable with technologies they have to imagine, show them what’s possible. For example, one project is developing in-home applications for hydrogen: whether an odorant needs to be added, where hydrogen accumulates if it leaks, and how readily combustible it is, among other questions. An exciting product of this work is a hydrogen show home that has cropped up in Gateshead. The house features hydrogen boilers, stoves, and fires that boast a beautiful orange flame (to book a visit, email hydrogenhome@northerngas.co.uk ). Project “H21” is testing the feasibility of 100% hydrogen supply up and down the UK’s current gas network, and another scheme involves blends of hydrogen and natural gas that can provide CO2 emissions reductions of around 6% and could serve as a key stepping-stone in scaling up and encouraging public acceptance of 100% hydrogen in the near future. Residents who participated in this project consistently reported that they couldn’t tell the difference between regular and blended boilers.

So how much hydrogen do we theoretically need? According to predictive models, this number varies from 23 to 182 TWh depending on the interplay between customer acceptance of hydrogen and the adoption of heat pumps. While it’s difficult to plan for a future that has so much uncertainty, the gas sector can prepare by ensuring hydrogen is as safe, well-planned, and easy to implement as possible for when the time comes to deploy. If companies like Cadent continue to innovate in this direction, hydrogen has my full support.

Ellie Martin is a master’s student in Imperial’s Sustainable Energy Futures course. Her undergraduate background is in Biochemistry and Molecular Biology at the University of Miami, and she’s interested in developing energy technologies through the intersection of engineering and molecular science.

Methane removal from the atmosphere- could it help us reach our climate goals?

By Dr Jasmin Cooper

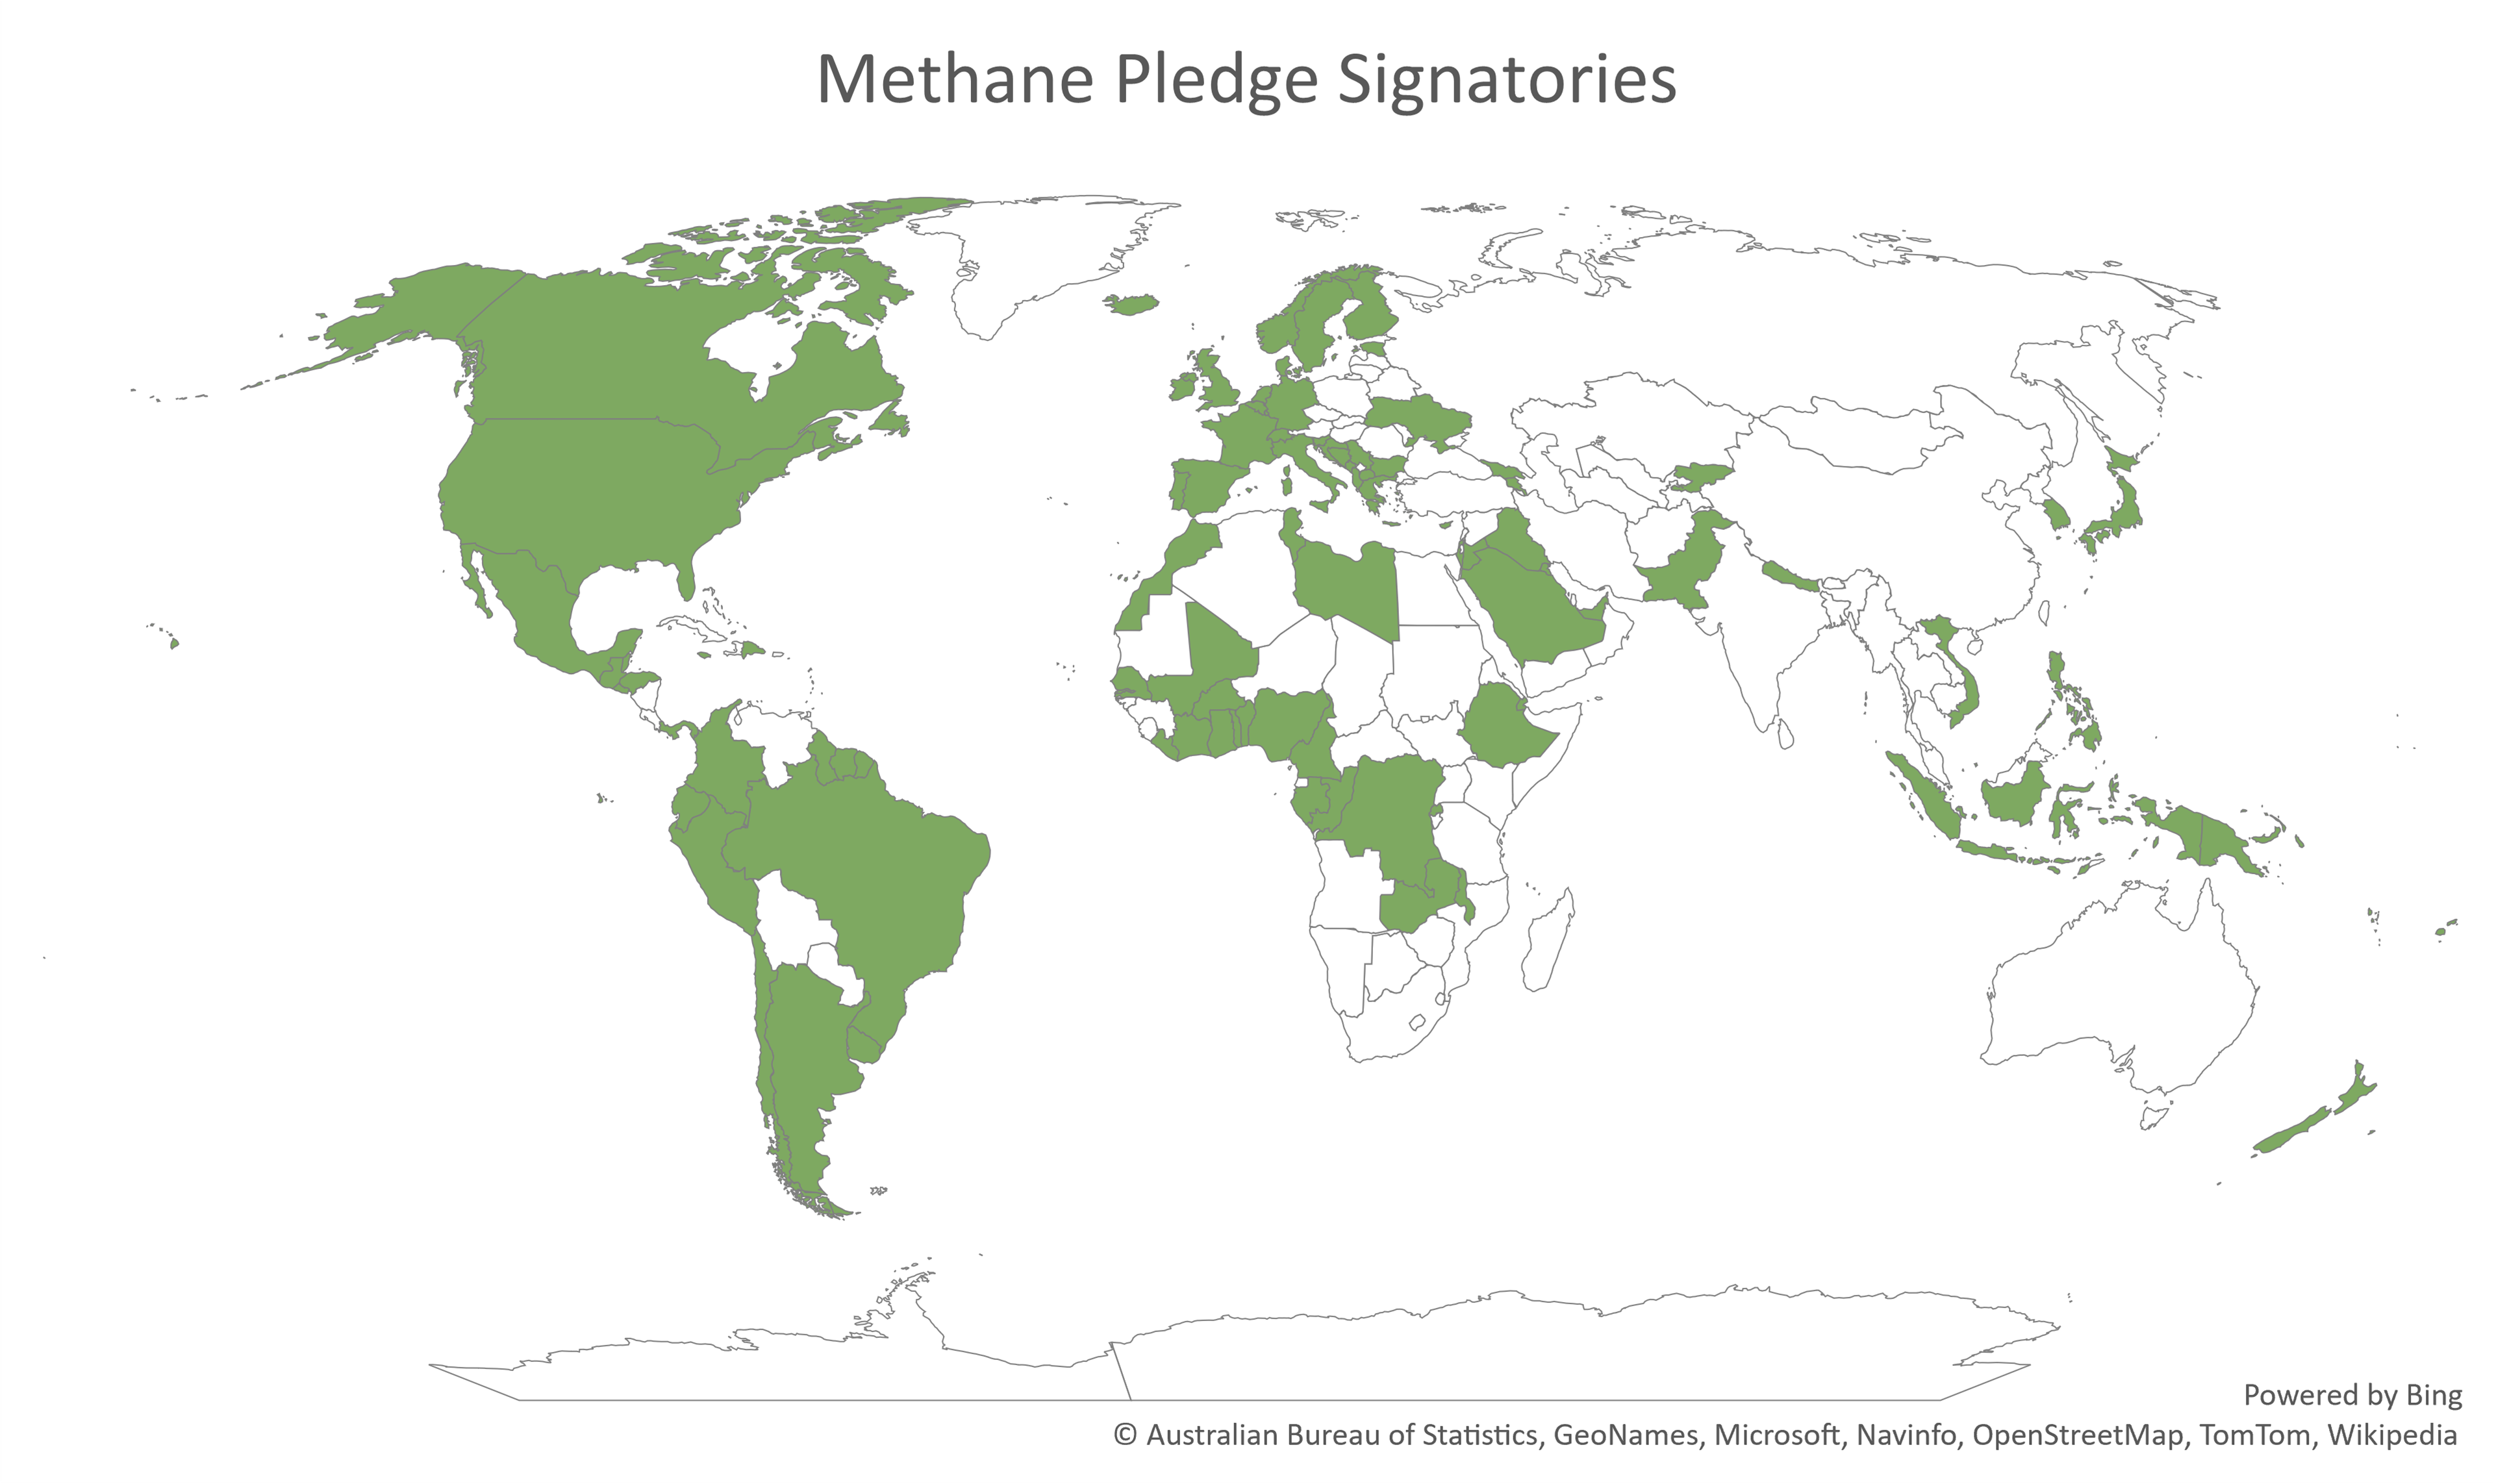
Methane is the second most important greenhouse gas and because of this, over 100 countries have pledged to cut their emissions of this potent greenhouse gas. All efforts so far to cut methane from the atmosphere have focused on reducing emissions, targeting sectors such as oil and gas, agriculture and waste management. While this is effective in reducing the amount of methane present in the atmosphere, they cannot reduce methane emissions to zero. Also, these actions could be hindered by methane emissions from thawing permafrost caused by current increases in global temperatures. Therefore, there may be the need to remove methane from the atmosphere, but this is an area with little ongoing research and many data gaps.

Unlike carbon dioxide which can be removed directly from the atmosphere, methane removal centres on enhancing the conversion of it into carbon dioxide, or other chemicals. The reasoning for this is because of methane’s strength as a greenhouse gas; 82.5 ± 25.8 times as powerful as carbon dioxide over 20-year time horizon and 29.8 ±11 times as powerful over 100-year time horizon (1). Therefore, by converting it into a less potent greenhouse gas, its global warming impacts are greatly reduced.

The methods which can be used to remove methane focus on increasing the size of existing methane sinks (natural systems which remove it from the atmosphere) or other ways of converting it into carbon dioxide and other chemicals:

Enhancing methane sinks

Physical

The main sink for methane is the reaction with hydroxyl (OH) radicals in the atmosphere, which coverts it into carbon dioxide. Therefore, methods of increasing the amount of OH radicals in the atmosphere would enhance the rate of methane removal. Iron-salts have been found to enhance OH radical formation from sea water by mimicking the reaction of mineral dust (2). By applying iron-salts to sea water, the formation of OH radical and Cl is enhanced, both of which react with methane.

Biological

The other sink for methane is microbes in the soil, which contain enzymes that can oxidise methane into carbon dioxide (3, 4). By increasing the concentration of these microbes in the soil or using them in equipment designed to remove methane from air e.g. biotrickling filtration (3), the concentration of methane in the atmosphere can be reduced.

Direct oxidation and conversion into other chemicals

Catalysts

Methane can be converted into carbon dioxide without OH radicals. Methane can react with oxygen in the presence of a catalyst, in a reaction similar to combustion, to produce water and carbon dioxide. Many catalysts can be used including photocatalysts, metal catalysts with zeolites and porous polymer networks (3). These are used in air contactors, like those used in direct air capture for carbon dioxide removal, where air flows through the materials containing the catalyst. Methane can also be oxidised to form methanol (3). It is also possible to directly converted methane into chemicals such as ethane and ethylene in the presence of a catalyst (5) and platinum-based catalysts have been found to be effective for this.

Barriers to methane removal

While it is possible to remove methane from the atmosphere, its direct removal is an area with little ongoing research. Reasons for this are that the concentration of methane in the atmosphere is much lower than carbon dioxide (~200 times lower; 1.88 ppm methane versus 410 ppm carbon dioxide). Therefore, it is more energy intensive to remove methane from the atmosphere because large volumes of air need to be processed to remove significant amounts of methane. Other reasons for why little scientific interest have been placed on methane removal is that it is currently much more effective to reduce the concentration of methane in the atmosphere by emissions abatement e.g., reducing venting and flaring in oil and gas or waste management practices in agriculture.

Could it help us reach our climate goals?

Overall, methane removal from the atmosphere could play a role in meeting future climate targets but this is dependent on how successful methane emission reduction initiatives are, as well as other decarbonisation strategies e.g. phasing out fossil fuels and ramping up renewable electricity. Methane removal is not a substitute for methane emissions abatement but could be complimentary to it if further sharper and deeper cuts to methane are needed to reach Paris Agreement goals. If net-zero pledges are successful and more initiatives like the Global Methane Pledge Methane are established, then methane removal is unlikely to play a role in future decarbonisation strategies.

References

  1. IPCC. AR6 Climate Change 2021: The Physical Science Basis. Geneva, CH: Intergovernmental Panel on Climate Change (IPCC); 2021.
  2. Oeste FD, de Richter R, Ming T, Caillol S. Climate engineering by mimicking natural dust climate control: the iron salt aerosol method. Earth Syst Dynam. 2017;8(1):1-54.
  3. Jackson RB, Abernethy S, Canadell JG, Cargnello M, Davis SJ, Féron S, et al. Atmospheric methane removal: a research agenda. Philosophical Transactions of the Royal Society A: Mathematical, Physical and Engineering Sciences. 2021;379(2210):20200454.
  4. Lawton TJ, Rosenzweig AC. Methane-Oxidizing Enzymes: An Upstream Problem in Biological Gas-to-Liquids Conversion. Journal of the American Chemical Society. 2016;138(30):9327-40.
  5. Li Z, Xiao Y, Chowdhury PR, Wu Z, Ma T, Chen JZ, et al. Direct methane activation by atomically thin platinum nanolayers on two-dimensional metal carbides. Nature Catalysis. 2021;4(10):882-91.


Will the global methane pledge make an impact in meeting climate goals?

By Luke Dubey

In the first week of COP26 a ground-breaking methane pledge was announced by the US and the EU. Very quickly over 100 countries, representing 70% of the global GDP and almost 50% of anthropogenic methane emissions had signed up. The pledge agrees to cut methane emissions by at least 30% by 2030 compared to 2020 levels. It is estimated that delivering on the pledge would reduce warming by at least 0.2°C by 2050. So how is this going to be achieved, will it work, and why are over half of the emissions not covered?

Each country that has signed the pledge can decide how to reduce its emissions. This could be through new technology, regulations, switching fuels or changing practices. Due to the completely different emission profiles of each country, emissions reductions will take a completely different form. For example, the EU is a large consumer of gas, but a low producer compared to the US which has very high gas production. The strategies in place for one country will be very different to another. Due to how recently the pledge was announced, most countries do not have a detailed outline of how they plan to reduce their emissions. But these will be required very rapidly as 8 years is a short time for such a large emission reductions.

Thus far, only the US has a detailed national action plan on how to cut emissions within their borders. The US action plan was published in November 2021 following the announcement of the pledge at COP26 by President Joe Biden, and outlined their strategy to cut emissions. The action plan has considerable focus on the oil and gas sector, aiming to reduce emissions from sources covered by the action plan by 75%. This includes pipelines which will be covered by a new leak detection and repair rule which would establish standards to detect and eliminate leaks. Plugging wells, reducing flaring and venting and improving standards for new and existing oil and gas sources are also included. The action plan, should it be successful, will provide a playbook for reducing oil and gas sector emissions. Other emission sources are also covered in the action plan. For landfill emissions, a reduction in emissions via regulations and a drive to reduce the quantity of food in landfills, with the goal of 70% of emission captured from landfill. The agriculture sector is tackled via new technologies such as anaerobic methane digestors. The action plan has shown the 30% reduction can be achieved by slashing emissions from the lowest hanging fruit, in the USA’s case oil and gas and landfills, while providing jobs. This will allow the harder to abate sectors to survive while the technology to reduce their emissions becomes less expensive and more feasible to implement.

If the US has shown (in theory) how drastic emission reduction can be achieved, while also providing co-benefits to the economy, why have all countries not signed up? This is the main failing of the pledge. The 30% emission reduction, while significant enough to aid us on the path to 1.5°C (if all countries signed up) was a reduction too big for some of the world’s largest emitters such as China, Russia and India. Their omission is a huge blow to the 1.5°C target where methane emissions need to decrease by 25 – 53% for it to be achieved. Moreover, the 30% reduction in many countries is not enough to meet the IEA’s net zero pathway which sees a 75% methane reduction in energy use. So, it would seem that the pledge, by not being adopted by some of the largest emitters, will not be enough to meet Paris goals. However, should the signatories demonstrate that emissions can be reduced, while implementing a methane tax price (some in the US have suggested $1800/ton) then these countries, through purely economics may be persuaded to reduce emissions. Getting these high emitting countries onboard will be key to the long-term success of the pledge and will have a large impact in whether climate goals can be met.

Overall, the methane pledge must be seen as a positive as it is the first large scale attempt at tackling this potent greenhouse gas globally. The omission of many large emitters is a great loss but must be placed in the context of many unwilling participants at COP26. Should the reductions in emissions from the signatories be successful it will pave the way for other countries to join. This in turn will go a great way in meeting climate goals.

Creating a Global Energy Systems Model – Dr Sara Giarola

Picture of Dr Sara Giarola
Dr Sara Giarola

We recently interviewed Dr Sara Giarola, Research Fellow at the Sustainable Gas Institute and the lead modeller for the energy systems model, MUSE. We asked her about how policymakers in governments are using MUSE and other models to inform their decision making for COP-26.

What is an energy systems model? Why are they important?

It was the Oil crisis in the 1970s that prompted the development of tools which described the links between energy supply, demand, and their impact on the energy security of many nations in the world. These tools were the first known energy system models.

An energy system model is a mathematical representation of the sources of energy (e.g. renewables and fossil fuels), the destinations for energy (or “end-uses”, which include all the diverse needs of energy of our society, from the electricity consumed in our houses to the electricity used to run electric vehicles), and all the possible ways with which energy can transform from one to another form. For example, wind power can be converted into electricity in wind farms and distributed to our households.

Energy system models can be quite diverse. However, their communal strength relies in combining energy technologies, with environmental (for example, the interactions between energy and climate) and societal factors, and different policies. This makes them privileged tools to evaluate the implications of climate policies and industrial strategies.

What is your background?

Being a chemical engineer, I have always been fascinated by mathematics, especially when used to describe phenomena occurring at any scale, from chemical reactions to interconnected macro-systems. Since my PhD, which was on the optimisation of biofuels in transport, I became interested in energy problems and made energy system modelling one of my main research interests.

A diagram showing MUSE
A diagram of MUSE

What is unique about MUSE?

MUSE (ModUlar energy system Simulation Environment) models all the possible ways in which energy can be transformed on a global scale. It differs from existing models in many ways, but the agent-based nature of the model is particularly important. Models attempt to capture the behaviour of individuals within an environment. MUSE has an accurate description of the investment and operational decisions made in each geographical region and sector.

MUSE, not only describes each energy sector model (e.g., natural gas or renewables) presenting a comprehensive picture of all technologies in the sector, but also captures the diversity of drivers. These drivers are what lead firms and consumers to buy a specific energy technology rather than another one, and build upon factors such as education level, wealth, principles, and socio-cultural context.

How can modellers help policy makers?

In compliance with the Paris Agreement, governments need to take fundamental decisions around their plans of actions for reducing the greenhouse emissions. Energy models can be used to run “what-if” analyses asking questions around the shape of the energy mix in the future. Many of applications will be published in an IPCC Assessment report to be published in 2022.

The upcoming UN Climate Change Conference of the Parties (COP26), will be a milestone review of current achievements and future targets in the decarbonisation process. One of the key questions which the world will have to face will be around securing a global net-zero target by 2050 while keeping the 1.5 degrees limit in temperature increase compared to pre-industrial time. In order to answer this question, the modelling community has been involved in an unprecedented effort to help provide evidence through model inter-comparison studies to help facilitate transparent and robust dialogue between stakeholders.

Who has been interested in the model? Who have you worked with?

MUSE is part of the the Paris Reinforce project and of the Climate Compatible Growth (CCG) programme.

Paris Reinforce builds upon an extensive modelling ensemble comprising five national/regional models for Europe, nine national models for countries outside of Europe, and eight global models. The project focuses on assessing climate policy decision within structured frameworks created around model inter-comparison studies in view of reaching the Paris Agreement targets, building bolder ambitions from existing Nationally Determined Contributions (NDCs) and National Economic and Climate Plans (NECPs).

CCG is a UK-research programme developed in preparation for COP26 to support investment in sustainable energy. Among the many research outputs, CCG analysts have produced a multi-model comparison study where four global energy system models and selected power sector models, were used to investigate the timing and rate of the global coal phase out, which is essential to foster a Paris Agreement-complaint energy system.

What challenges have you faced?

wind energy farm
Wind farm (Source: Pixabay)

One of the main difficulties of the energy system models, is to translate into research questions stakeholders’ concerns: workshops and surveys are important to identify their priorities. Similarly, translating the research finding into a message to policymakers and stakeholders could also be challenging, as models always bear a certain level of approximation of the real-world phenomena due to their inherent mathematical description.

What surprises have you come across?

It is interesting to see where major barriers to decarbonisation may lie. We recently modelled the real market segmentation of the ammonia industry in China, the biggest world ammonia manufacturer. As enterprises vary in size and governance, a net-zero transition becomes less favoured if specific policy mechanisms are absent to ensure competitivity. Therefore, in China, a net-zero ammonia industry would need to go beyond the unique implementation of a carbon tax and adopt more sophisticated subsidy schemes to allow the transition for enterprises with lower access to capital.

How can one find out more?

Information on the MUSE model can be found on the new Imperial College microsite, where you will see who is working on the model, our publications, and of stories from researchers sharing their views on the energy system transformations.

We will also launch our energy system simulator in the next month, where you can explore how the energy mix might evolve between now and 2100.

MUSE will soon be available as an open source software on a Github where you can copy the code, learn how the model works, and suggest ways to improve it, in a truly transparent global collaboration.

How much methane does the oil and gas sector emit?

By Dr Jasmin Cooper

Research Associate, Sustainable Gas Institute 

Methane is a major greenhouse gas and in recent year many companies in the oil and gas value chain have either joined initiatives or set ambitious targets in a bid to curb their emissions e.g. the oil and gas methane partnership (OGMP), the oil and gas climate initiative (OGCI) and methane intensity targets set by major oil and gas companies (GMI, 2020, OGCI, 2018, Shell, 2018, Xu et al., 2020). The quantification of emissions is undoubtably a key component of emission reduction strategies, but there is a high level of uncertainty in the emissions data globally. This is largely because, in comparison to carbon dioxide, there was a lack of interest until the second half of the 2010s when post the Paris Agreement, a spotlight was shone on short-lived climate forcers (e.g. methane, ozone, black carbon) and their role in reducing warming.

The global atmospheric concentration of methane has been increasing since preindustrial times and since the 1980s it has been rising rapidly (Dlugokencky, 2021). The International Energy Agency (IEA) reported in their Methane Tracker that oil and gas methane has been rising since the year 2000, with emissions peaking in 2019 (IEA, 2021b). The impacts of COVID-19 appear to have led to a drop in emissions, because of reductions in oil and gas demand because of slowdowns in industrial and economic activity. However, post COVID-19, it is imperative that 2019 remain the emissions peak if the sector is to contribute towards net-zero ambitions. This is because with methane being a potent greenhouse gas, reductions in emissions can lead to significant climate change and global warming benefits.

In the oil and gas sector, as well as in other sectors, methane emissions are quantified using one (or a combination) of three methods (National Academies of Sciences and Medicine, 2018): engineering calculations (including process modelling/simulation and using equipment specifications), emission factors (coefficient used to calculate emissions) and direct measurement. Out of these three, direct measurement is the most accurate for quantifying emissions and is also the only method which allows for the accounting and identification of emission sources. Data derived from direct measurement are also value inputs in emissions modelling via process simulation, as well as in updating or deriving emission factors. There is a broad spectrum of quantification technologies available, ranging from handheld devices, such as flow meters, to remote devices, such as observation stations and satellites. The measurement capabilities of these technologies also vary along the spectrum, from low level to extremely high emission rates and quick measurements to hours long measurement surveys.

However, quantifying emissions through direct measurement is expensive and time consuming. This, in combination with the lag in methane interest has results in a large proportion of global oil and gas related methane emissions being quantified using generic emission factor data. Major oil and gas countries such as the USA, Norway and Australia quantify their emissions using data derived from measurement campaigns, while others such as Egypt, Malaysia and Bolivia rely on default emission factors. Also, the sections of the oil and gas value chain (upstream, midstream and downstream) vary in how emissions are quantified. In countries which are major gas importers, such as Japan, Italy and Germany, emissions from the midstream and downstream activities are quantified using data derived from measurement surveys, while emissions from any upstream production and processing activities are quantified using either generic emission factors or country specific emission factors derived from expert estimates and industry reports.

Therefore, it is clear that actions need to be taken to homogenise the quality of both the emissions data and the emissions reporting, both between countries and within countries. The IEA launched in January 2021 their regulatory roadmap and toolkit (IEA, 2021a), which aims to provide guidance for policy makers who are looking to develop regulations to tackles their oil and gas methane emissions. A key step in this roadmap is developing an emissions profile.

For this step, accurate emissions data is needed, not just in magnitude of emissions and identifying all emission sources, but also in determining emission patters e.g., constant continuous, intermittent, episodic, inter-daily variable and intra-daily variable. These are important as they will directly impact any abatement measures and strategies developed, as well as any new regulations introduced to curb emissions. Hence, more efforts must be put into measuring emissions in all active oil and gas countries (both producers and consumers). The effectiveness of methane abatement measures will be hindered if the underlying emissions data is poor as either not enough or too many efforts could be put in, or efforts are not targeting the key emission sources.

References

Dlugokencky, E. 2021. Trends in atmospheric methane: Global CH4 monthly means [Online]. Boulder, CO, USA: National Oceanic and Atmospheric Administration/Global monitoring Laboratory (NOAA/GML). Available: https://www.esrl.noaa.gov/gmd/ccgg/trends_ch4/ [Accessed].

GMI. 2020. UNEP: Oil and Gas Methane Partnership Initiative to Manage Methane Emissions from Upstream Oil and Gas Operations [Online]. Global Methane Initiative (GMI). Available: https://globalmethane.org/challenge/ogmp.html [Accessed October 2020].

IEA. 2021a. Driving Down Methane Leaks from the Oil and Gas Industry, Paris, FR; International Energy Agency (IEA). Available:’ https://www.iea.org/reports/driving-down-methane-leaks-from-the-oil-and-gas-industry

IEA. 2021b. Methane Tracker 2021, Paris, FR; International Energy Agency (IEA). Available:’ https://www.iea.org/reports/methane-tracker-2021

National Academies of Sciences, E. & Medicine 2018. Improving Characterization of Anthropogenic Methane Emissions in the United States, Washington, DC, The National Academies Press.

OGCI. 2018. Oil and Gas Climate Initiative sets first collective methane target for member companies [Online]. New York, NY, USA: Oil and Gas Climate Initiative (OGCI). Available: https://oilandgasclimateinitiative.com/oil-and-gas-climate-initiative-sets-first-collective-methane-target-for-member-companies/ [Accessed June 2020].

Shell. 2018. Why shell has set a methane target [Online]. The Hague, NL: Royal Dutch Shell Available: https://www.shell.com/media/speeches-and-articles/2018/why-shell-has-set-a-methane-target.html [Accessed June 2020].

Xu, M., Aizhu, C. & Jacob-Phillips, S. 2020. China’s CNPC targets 50% slash in methane emission intensity by 2025. Reuters, 2 July 2020.

By Dr Jasmin Cooper

Research Associate, SGI

Satellites – The Future of Methane Measurement?

Author: Luke Dubey, Research Assistant, Sustainable Gas Institute


Methane satellite


Methane is the second most important greenhouse gas after CO2. While emissions are far lower than CO2 it has a far higher global warming potential and so is responsible for 25% of today’s anthropogenic climate forcing (Myhre et al., 2013). Methane is the main constituent of natural gas, which is important due to the increasing use of natural gas as a transition fuel. Measuring and estimating emissions from the natural gas supply chain is difficult due to methane being odourless and colourless, and emissions being widespread and intermittent. Should the emission rate of methane be higher than currently estimated the climate benefits of gas relative to coal could be wiped out.

How are emissions measured

Methane emissions from the natural gas supply chain are currently estimated using either bottom-up methods, such as handheld devices and mobile laboratories, or top-down methods such as aeroplanes and satellites. A current issue is that bottom-up methods tend to estimate lower emission rates than top-down methods, even in the same area, and it is not clear whether one is under or another over-estimating emissions.

Satellites have been used for detecting and measuring methane for 20 years. During this time their technology has improved massively, largely by lowering minimum detection limits and increasing resolution. As their technology has improved, their potential role in the natural gas industry has been realised. It is widely hoped they will be able to provide comprehensive coverage, detecting all emissions in an area (which may sometimes not allow access), while returning daily, providing constant measurements. This is highlighted within the EU’s methane strategy, which promotes the Sentinel 5P satellite as capable of measuring global emissions (European Commission, 2020).  However, there are many reasons why satellites might not be up for the task just yet, while still having immense potential in the future.

Limiting factors of satellites

1.      Cloud cover

Satellites have a few issues that are not widely enough discussed, the first being non-detectable pixels. A pixel is the base unit a satellite reports data in, these range from 60km2 for Envisat to 7km2 for Sentinel 5P all the way down to 50m2 for GHGSat. There are many factors that can cause a no detect in a pixel, such as aerosols, albedo and terrain, but the most important is cloud cover. Spectrometers onboard the satellites are what measure the methane; there are many ways to do this but a common one is using sunlight that is backscattered from the earths surface into the spectrometer. The absorption peaks are then analysed and the total concentration of methane in the column is outputted (Jacob et al., 2016). It is clear then how clouds could interfere with this process, with thin clouds causing too much noise for accurate results and thick clouds completely blocking out the sunlight. Many places that produce gas are cloudy virtually year-round (Russia, Canada), meaning there is no way to measure every day of the year with many areas having at best a couple days coverage per pixel per year. Technology has improved over time and will continue to do so, and new methods of reducing the noise from low cloud coverage have been developed, but there is still a long way to go.

2.      Minimum detection limits

A second issue is the minimum detection limits (MDL) of satellites. The MDL is a consequence of the uncertainty within the satellite’s instruments. This will lower as technology improves, and it is possible to reduce over repeated measurements. However, many of the emissions from natural gas are low level and spread out, such as from wells, meaning satellites are unlikely to be able to discern these from the background noise. The saving grace of the MDL is that emissions from natural gas follow a superemitting profile, where a few high emitting sources are responsible for the majority of emissions (Brandt et al., 2016). These are far more likely to be detected by the current crop of satellites and have been a common use of satellites thus far.

3.      Time of overpass

Another aspect of satellites that does not receive enough, if any, attention is the time of overpass. This is fundamentally important when measuring emissions from intermittent sources prevalent across the natural gas supply chain. Should a large emission occur immediately before an overpass the methane will have no time to disperse, increasing the likelihood it is above the MDL and detected. Should the same emission happen hours before an overpass, there is a long time for winds to disperse the emission into nearby pixels, or even distant pixels if long enough has passed. This results in no detection happening and zero emissions being attributed to the pixel. Conversely, if the emission rate detected in the first scenario was extrapolated up to a daily or yearly average, it would greatly overestimate total emissions. Increasing the number of days measured would reduce this effect, or having several satellites working in tandem, measuring at different times of day would help solve the issue.

Newer satellites

The counter to some of the issues raised is in the newest crop of ‘paid for’ satellites. Where the data is not freely available online, but private institutions pay for access, such as GHGSat. These satellites have far higher resolution and lower MDLs. The higher resolution increases the likelihood of an individual pixel being cloud free (chance of no clouds in one of 10,000 100m2 pixels or one 10km2 pixel). However, I believe these satellites play a different role, more comparable to an aeroplane than a traditional satellite. These satellites do not have the ability to globally track emissions daily, but target specific facilities. A hope is that these satellites could work in tandem with more traditional satellites, where one would scan the globe and detect an area of interest, and the other then has a more detailed look. All of this being possible rapidly, stopping hidden emissions far quicker than ever before. With the recent launch of GHGSat C (Iris) and the upcoming launch of MethaneSat this seems a very real possibility.

Conclusion

So what’s the role of satellites now and in the future? Currently satellites are useful for research, but uncertainties are too high for commercial use in the most part. However, satellites can currently play a very helpful role in locating superemitters. As technology improves satellites will become more useful, this will be aided by more satellites coming online, working in tandem to mitigate some of the limitations. Satellites have the potential to comprehensively measure emissions globally at the drop of a hat, this potential has received, and deserves, the time and investment fitting of such a game changing climate change technology. I am hopeful in the near future satellites will be the primary way of measuring methane globally.

BRANDT, A. R., HEATH, G. A. & COOLEY, D. 2016. Methane Leaks from Natural Gas Systems Follow Extreme Distributions. Environmental Science & Technology, 50, 12512-12520.

EUROPEAN COMMISSION. 2020. EU Methane Strategy [Online]. Available: https://ec.europa.eu/energy/topics/oil-gas-and-coal/methane-emissions_en#eu-methane-strategy- [Accessed 6/1/21 2021].

JACOB, D. J., TURNER, A. J., MAASAKKERS, J. D., SHENG, J., SUN, K., LIU, X., CHANCE, K., ABEN, I., MCKEEVER, J. & FRANKENBERG, C. 2016. Satellite observations of atmospheric methane and their value for quantifying methane emissions. Atmospheric Chemistry and Physics, 16, 14371-14396.

MYHRE, G., SHINDELL, D., BRÉON, F. M., COLLINS, W., FUGLESTVEDT, J., HUANG, J., KOCH, D., LAMARQUE, J. F., LEE, D., MENDOZA, B., NAKAJIMA, T., ROBOCK, A., STEPHENS, G., TAKEMURA, T. & ZHANG, H. 2013. Anthropogenic and natural radiative forcing. In: STOCKER, T. F., QIN, D., PLATTNER, G. K., TIGNOR, M. M. B., ALLEN, S. K., BOSCHUNG, J., NAUELS, A., XIA, Y., BEX, V. & MIDGLEY, P. M. (eds.). Cambridge, UK: Cambridge University Press.

Author: Luke Dubey, Research Assistant, Sustainable Gas Institute