Emissions from fossil fuels or biological sources, a decrease in the atmosphere’s ability to break down methane or something else? The emissions work of the SGI relies on data that uses advanced chemical science to enable the identification of methane from different sources. In part one of a two-part blog, Dr Semra Bakkaloglu from our emissions team, explains the atomic-level forensics that scientists use to determine where methane came from.
The SGI’s work on methane emissions is important for understanding how governments and industries involved in energy supply chains can reduce emissions of this very significant greenhouse gas (GHG).
Our research focuses on methane emitted from natural gas, biogas and hydrogen supply chains. These are anthropogenic sources of methane; neither would be a significant problem without the human ingenuity that created their supply chains. To do our research, we need to be sure the sampling and monitoring data we use has distinguished correctly between naturally occurring methane such as that from wetlands – and anthropogenically induced emissions such as from livestock farming and energy supply chains.
But surely methane is just methane, right? CH4 – an odourless, invisible, flammable gas made up of one carbon atom, bonded to four hydrogen atoms. Where do you start to tell the difference between methane that has bubbled up from the swampy depths of decomposing wetland and fossil methane that has propelled itself to freedom through a leaky flange in a 50-year-old natural gas pipeline?
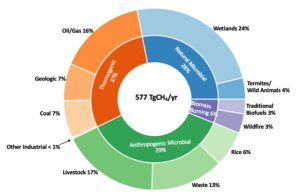
Fig 1 A plausible CH4 emissions budget ca. 2015 based on Lan et al., 2021 that is in agreement with both observed atmospheric CH4 and 13CH4 (given in Fig 2). Atmospheric methane grew by 10 ppb in 2015 implying a global atmospheric chemical sink of 548 TgCH that year (Lan et al., 2021; NOAA, 2021 Picture taken from NOAA, 2022)
To calculate that – and arrive at a chart such as fig. 1 – the answer lies in the number of neutrons. Methane isotopes are variations of the methane molecule that have a different number of neutrons in their atomic nuclei. Tracing the sources and dynamics of methane in the environment involves using the specific characteristics of these isotopes to identify where the methane came from and how it is behaving. This is done by analysing the ratios of different isotopes in a sample and comparing them to known ratios from each specific source.
The most common methane stable isotope is carbon-12 (C12), which has 6 protons and 6 neutrons, and carbon-13, the heavier isotope; as well as hydrogen isotopes such as H-1 or H2 (deterium, denoted as D). Each CH4 source exhibits different partitioning of light (12C or H) and heavy (13C or D) isotopes of carbon and hydrogen, so 13C/12C or D/H. This provides the “DNA” for us to determine the source.
By carefully calculating the ratio of the most prevalent form of carbon, carbon-12, and its stable isotope, carbon-13 (13C), which has an extra neutron, we can determine the origin of the carbon in a methane sample.
13C is a tiny bit heavier than 12C. Methane produced by microorganisms in environments such as wetlands, landfills, and agriculture has very little 13C (Bakkaloglu et al. 2022), so the signature of microbial methane is “lighter” than methane produced by fossil fuels, such as natural gas. Livestock methane is created as a by-product of digestion in the stomachs of ruminants, such as cattle, sheep, and goats. The isotopic composition of livestock methane is also dependent on the diet of the animals, but it is generally similar to that of biogas methane, with a lower ratio of 13C to 12C compared to fossil fuel methane.
By analysing the methane isotopic composition, scientists can determine the relative contribution of different sources to the overall methane levels in the atmosphere and track how methane is distributed and transformed over time, whether it is formed biogenically (agricultural, waste or wetlands), thermionically (natural gas, oil or coal mining) or pyrogenically (incomplete combustions, such as wildfires).
Scientific isotopic methane data provides an essential fingerprint without which we’d be unable to carry out our work on understanding emissions. If we can understand the source of methane, we can develop better mitigation strategies to tackle it.
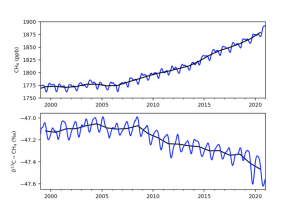
But there’s still some controversy. Fig 2 shows the trend in atmospheric methane concentration (top) and Carbon-13 ratio. It is clear that whilst overall methane levels in the atmosphere are rising +100ppb in 20 years, (NOAA, 2023) the ratio of C-13 is falling. Schaefer et al. 2016 suggested that the methane isotopic signature is shifting from fossil fuels to biogenic sources in the 21st century. So the question is – is this because we have reduced fossil fuel-related methane emissions (Schwietzke et al. 2016), or has there been a greater increase in biogenic methane emissions or the changes in sink mechanism or both? According to the IEA (2022), methane emissions from fossil fuels increased by close to 5% in 2021, and Menoud et al (2022) found that fossil fuel-related sources could have more depleted values than previous estimates used in global models. But there is still large uncertainty coming from natural sources. We should take into account both each source methane emission and their isotopic signature to better understand the global methane budget.
We’ll look at that in Part 2.