Category: Greenhouse gas emissions

Methane origins – part II: The millennium methane plateau and post-plateau rise

At the end of part 1, we touched upon how at the turn of the millennium and through the first half of the noughties, scientists working in emissions monitoring observed a plateau in what had been steadily increasing atmospheric methane concentrations. It was a phenomenon very much against the expected trend and the reasons behind it still generate scientific debate and controversy. So for part 2 of our methane origins story, Dr Semra Bakkaloglu turns ESI (Emissions Scene Investigator) to cast a magnifying glass over the evidence, and offers her perspective on what caused the plateau, and what’s been happening since


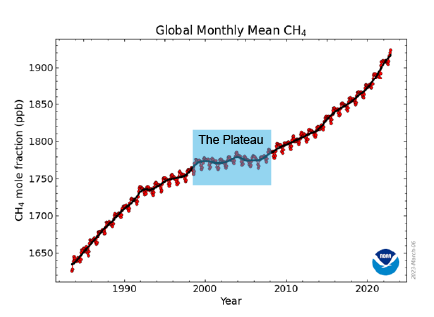
Since the beginning of the industrial revolution, the concentration of atmospheric methane has increased around threefoldWe know this from a variety of scientific research efforts, including analysis of air trapped in ice cores which can be mapped to specific time-frames and the establishment, since 1983, of modern sampling and monitoring programmes for atmospheric methane concentration. This accumulation of data has corroborated an upward trend that was largely unabatedThat was until 1999 when the increase abruptly stopped.

It wasn’t a short pause either. This plateau – where atmospheric methane concentrations more or less remained constant – went on for seven years. Only in 2006 was ‘normal service resumed’ and the relentless increase in concentration recommenced.

Fig 1 – CH4 trend: This graph shows globally-averaged, monthly mean atmospheric methane abundance determined from marine surface sites since 1983. (NOAA Global Monitoring Laboratory)

So was something, somewhere, absorbing the methane? Was it being degraded at a faster rate? Was it that we were producing less methane from anthropogenic sources such as agriculture or oil and gas production? Or had natural biogenic methane sources, for some reason, gone into decline?

The 7-year plateau and renewed growth since have been the subject of conflicting explanations in the literature.

Dlugokencky et al. (2003) suggest that the stabilisation may be a new steady state for atmospheric methane, and it is the renewed growth that is anomalous.

Others argue the increase in methane concentrations has continued for more than a decade, indicating that the plateau period from 1999 to 2006 could be seen as unusual (Turner et al. (2017)).

That leaves us with an intriguing question – which is the anomaly? The relentless growth since 2006 or the stable period of plateau.

So the focus of research should be on explaining the anomalous stabilisation period and identifying the sources of emissions that contribute to the continued rise of methane after stabilisation period. 

Scientists turned to carbon isotopes (which we explored in part 1) to try and understand exactly what had stopped the increasing concentration in its tracks. After all, if we can understand why, we might be able to put that to use in a technology that allows us to influence methane concentration levels.

Let’s start with the isotopic ratios. We know that different proportions of carbon isotopes provide a signature for the source of methane. The pattern of 13C enrichment (less negative, heavier), along with a stable d13C, corresponds to the trends in methane concentration until the end of the 1999 and 2006 plateau (see Fig.2).

Fig 2. Global trends in methane mole fraction (A) and it isotopic signature (B) (Taken from Schaefar et al. (2016)

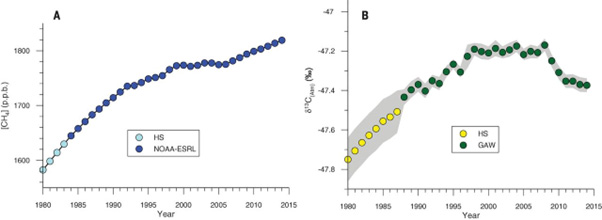
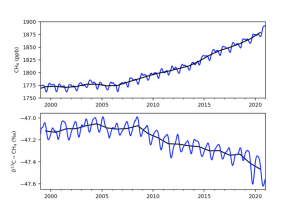
Post-plateau, there is an increase in the concentration of methane, accompanied by a depletion of 13C in the δ13C. This implies that the emissions before and after the plateau have different δ13C values.  

Various studies have suggested different explanations for the plateau in the 2000s and the growth of atmospheric methane since.

Decreased microbial methane production?
Kai et al. (2011) suggest that reduced growth rate can be explained by decreased microbial sources based on isotopic analysis.

A more active methane sink?
On the other hand, studies including methyl chloroform measurements indicate that changes in the methane sink played a role in both stabilisation and subsequent (Turner et al. 2017; McNorton et al. 2016). Turner et al. (2017) suggest that an explanation for the stabilisation is that the OH sink has increased, which has offset the increase in methane emissions.

A reduction in biomass burning?
Worden et al. (2017) used carbon monoxide measurements to suggest a decrease in biomass burning emissions (more enriched in 13C), which could explain the potential increase in both fossil fuel and microbial emissions.

A reduction in emissions from Oil and Gas?
Chen and Prinn et al. (2006) argue that fossil fuel sources decreased, a view backed up by Schaefar et al. (2016) 10 years later – that the plateau in methane levels can be attributed to reduced oil and gas production and investment into updating oil and gas infrastructure – largely a result of the collapse of the Soviet Union in 1992. This study qualified that  The plateau in methane  mole fraction could be due to variations in the hydroxyl methane sink alone, or it could be a combination of variations in the hydroxyl methane sink and reduced fossil fuel emissions.

There’s some important corroborating evidence here too; measurements of atmospheric ethane (almost solely a biproduct of the oil and gas sector) also showed a decline. Simpson et al. (2012) showed that global ethane emission rates declined from 1984 to 2010.

It can now be affirmed that the reduction in natural gas venting and flaring in oil fields contributed to this decrease, rather than a reduction in biofuel usage or biomass burning.

Chen and Prinn et al. (2006) reported an increase in emissions from rice and biomass burning, and suggested that a decrease in the energy sector could be the reason for the plateau. However, the evidence suggests that the reduction in fossil fuel emissions had a greater impact. It’s an observation that also clarifies why the isotopic signature remained unchanged during this interval – since rice emissions are depleted, and biomass burning emissions are more enriched than fossil fuel emissions.

Whilst isotopes are useful, the scientific toolkit for measuring slight and long-term changes in individual methane source strengths doesn’t yet allow us to accurately forecast future atmospheric methane levels with certainty.  New tools could help us improve our understanding in the sharp growth in methane concentrations since 2006 – and to examine that – you’ve guessed it – we’re going to need another blog!

Methane – an origin story

Emissions from fossil fuels or biological sources, a decrease in the atmosphere’s ability to break down methane or something else? The emissions work of the SGI relies on data that uses advanced chemical science to enable the identification of methane from different sources. In part one of a two-part blog, Dr Semra Bakkaloglu from our emissions team, explains the atomic-level forensics that scientists use to determine where methane came from.


The SGI’s work on methane emissions is important for understanding how governments and industries involved in energy supply chains can reduce emissions of this very significant greenhouse gas (GHG).  

Our research focuses on methane emitted from natural gas, biogas and hydrogen supply chains. These are anthropogenic sources of methane; neither would be a significant problem without the human ingenuity that created their supply chains. To do our research, we need to be sure the sampling and monitoring data we use has distinguished correctly between naturally occurring methane such as that from wetlands – and anthropogenically induced emissions such as from livestock farming and energy supply chains.

But surely methane is just methane, right? CH4 – an odourless, invisible, flammable gas made up of one carbon atom, bonded to four hydrogen atoms. Where do you start to tell the difference between methane that has bubbled up from the swampy depths of decomposing wetland and fossil methane that has propelled itself to freedom through a leaky flange in a 50-year-old natural gas pipeline?

Fig 1 A plausible CH4 emissions budget ca. 2015 based on Lan et al., 2021 that is in agreement with both observed atmospheric CH4 and 13CH4 (given in Fig 2). Atmospheric methane grew by 10 ppb in 2015 implying a global atmospheric chemical sink of 548 TgCH that year (Lan et al., 2021; NOAA, 2021 Picture taken from NOAA, 2022)

To calculate that – and arrive at a chart such as fig. 1 – the answer lies in the number of neutrons. Methane isotopes are variations of the methane molecule that have a different number of neutrons in their atomic nuclei. Tracing the sources and dynamics of methane in the environment involves using the specific characteristics of these isotopes to identify where the methane came from and how it is behaving. This is done by analysing the ratios of different isotopes in a sample and comparing them to known ratios from each specific source.

The most common methane stable isotope is carbon-12 (C12), which has 6 protons and 6 neutrons, and carbon-13, the heavier isotope; as well as hydrogen isotopes such as H-1 or H2 (deterium, denoted as D). Each CH4 source exhibits different partitioning of light (12C or H) and heavy (13C or D) isotopes of carbon and hydrogen, so 13C/12C or D/H. This provides the “DNA” for us to determine the source.

By carefully calculating the ratio of the most prevalent form of carbon, carbon-12, and its stable isotope, carbon-13 (13C), which has an extra neutron, we can determine the origin of the carbon in a methane sample.

13C is a tiny bit heavier than 12C.  Methane produced by microorganisms in environments such as wetlands, landfills, and agriculture has very little 13C (Bakkaloglu et al. 2022), so the signature of microbial methane is “lighter” than methane produced by fossil fuels, such as natural gas. Livestock methane is created as a by-product of digestion in the stomachs of ruminants, such as cattle, sheep, and goats. The isotopic composition of livestock methane is also dependent on the diet of the animals, but it is generally similar to that of biogas methane, with a lower ratio of 13C to 12C compared to fossil fuel methane.

By analysing the methane isotopic composition, scientists can determine the relative contribution of different sources to the overall methane levels in the atmosphere and track how methane is distributed and transformed over time, whether it is formed biogenically (agricultural, waste or wetlands), thermionically (natural gas, oil or coal mining) or pyrogenically (incomplete combustions, such as wildfires).

Scientific isotopic methane data provides an essential fingerprint without which we’d be unable to carry out our work on understanding emissions.  If we can understand the source of methane, we can develop better mitigation strategies to tackle it.

Fig 2. Globally averaged atmospheric CH4 (top) and the trend in the ratio of the isotope carbon-13(bottom) from samples collected by NOAA’s Global Greenhouse Gas Reference Network. The blue curves are derived from weekly data and the black curves are annual means. The data from 2020 are preliminary. Credit: Xin Lan, NOAA Global Monitoring Laboratory(Lan et al. 2021; NOAA,2021) 2021

But there’s still some controversy.  Fig 2 shows the trend in atmospheric methane concentration (top) and  Carbon-13 ratio.  It is clear that whilst overall methane levels in the atmosphere are rising +100ppb in 20 years, (NOAA, 2023) the ratio of C-13 is falling. Schaefer et al. 2016 suggested that the methane isotopic signature is shifting from fossil fuels to biogenic sources in the 21st century. So the question is – is this because we have reduced fossil fuel-related methane emissions (Schwietzke et al. 2016), or has there been a greater  increase in biogenic methane emissions or the changes in sink mechanism or both? According to the IEA (2022), methane emissions from fossil fuels increased by close to 5% in 2021, and Menoud et al (2022) found that fossil fuel-related sources could have more depleted values than previous estimates used in global models. But there is still large uncertainty coming from natural sources. We should take into account both each source methane emission and their isotopic signature to better understand the global methane budget.

We’ll look at that in Part 2.

How big a setback is the Nord Stream gas leak for climate change goals?

The news that the Nord Stream gas pipelines have stopped leaking is a relief to all of us involved in curbing emissions from methane, but the consequences of such a massive gas leak are still of huge concern. In her latest blog, the Sustainable Gas Institute’s Dr Jasmin Cooper examines how big an effect the alleged sabotage of the pipelines might have on climate change goals.

The Nord Stream 1 and 2 pipelines are two large subsea pipelines which connect Russia to Germany. The pipelines are the primary source of Russian gas exports to Germany.  Until the Russian invasion of the Ukraine in February they transported up to 55 billion cubic meters of gas per year, accounting for most of Germany’s gas imports. On September 26th 2022 two small tremors were detected by the Geological Survey of Denmark. Whilst there was no active flow through the pipelines by this point, they were still full of gas. The tremors are believed to have been caused by deliberate explosions – alleged sabotage that has resulted in four major methane leaks.

The leaks have caused concerns around the security of energy infrastructure as well as the security of energy supplies globally. After the announcement of the first leak in the Nord Stream 2 pipeline, gas prices across Europe jumped – having been falling since a previous peak in August. The leaks also raised energy security concerns in Europe as the continent heads into winter. However, Germany secured two floating liquefied natural gas (LNG) terminals in August of this year and in mid-September was in talks with Qatar and the United Arab Emirates to secure LNG deliveries. In August of this year, the mainland EU member states agreed to a plan to cut gas use by 15%3, so the damage caused to the Nord Stream pipelines may not impact gas supply so much as the rise in gas prices.

While there is still a lot of uncertainty around the leak; including the cause, the extent of the damage to the pipeline and how much natural gas has leaked out – this incident has the potential to be one of the biggest climate disasters so far in the 21st century. Subsea pipeline leaks are unusual so there are no past examples to directly compare to.

Deep Water Horizon was a drilling rig in the Gulf of Mexico which exploded in April 2010 resulting in huge damage to the marine environment from oil. The Nord Stream leaks are natural gas, so the environmental impacts will be to climate change and global warming rather than a direct impact on the marine environment and wildlife. Our only comparable large gas leaks are the Aliso Canyon gas leak, which is estimated to have emitted 97,100 tonnes4 of methane between October 23rd 2015 and February 18th 2016 and the Raspadskya coal mine leak, which was found to be emitting nearly 90 tonnes of methane per hour5 earlier this year  – and could emit 764,000 tonnes of methane by the end of 2022. .

The Nord Stream pipelines while not actively transporting gas, did contain 778 million cubic meters of natural gas. This would be 360,000 to 460,000 tonnes of methane, which in CO2 equivalence is 11 million to 14 million tonnes of CO2eqb. In the context of total global methane emissions, between 2008 to 2017 total global emissions were 576 Tg CH4 per year (1 Tg = 1,000,000 tonnes), with 80 Tg CH4 per year from the oil and gas sector. So, the amount of gas stored is equal to less than 0.1% of total global methane emissions, or 0.5-0.6% of annual oil and gas methane emissions. While this may seem like a small percentage, they are similar to the methane emissions of Denmark, Ghana or Yemen in 2021. That volume of gas has an economic value – based on prices on 05 October 2022 – of €1.4 billion and is approximately 5 days’ worth of supply to Germany based on Nord Stream transport when it was operational.  So from a climate, social and economic perspective, this is a catastrophic loss.

How much of the methane stored in the two pipelines will be emitted is yet to be determined. From the amount of gas stored and the images of the leak, it is evident the leak will be a big blow to ambitions to meet climate change targets. The Global Methane Pledge – launched in November 2021 – has seen over 120 countries pledge to cut their methane emissions by 30% (relative to 2020 levels) by 2030. Since then, many have launched new regulations on how their methane emissions can be slashed. The Nord Stream leaks will likely negate much of the progress made so far.

assuming natural gas is 70 to 90% methane and methane density of 0.7 kg per cubic meter
assuming GWP100 of 30 TFF
assuming gas price €174.76 per MWh; 36 PJ per 1 bcm of natural gas

How successful is the UK’s Net Zero strategy in the biowaste sector?

Greenhouse gas (GHG) emissions from the waste sector are primarily composed of methane (CH4) released from landfills. Biodegradable wastes such as food, garden waste, manure, paper and cardboard emit methane during anaerobic decomposition in landfills. In our latest blog, SGI emissions scientist Dr Semra Bakkaloglu explains some of the key findings from her newly published paper into emissions of CH4 from biowaste.

We know that CH4 is around 28 times more potent as a greenhouse gas than carbon dioxide (CO2) over a 100-year period (IPCC 2021). So, reducing CH4 emissions – from all sources – is critical to keeping global median temperature rise well below 2 degrees Celsius. In the UK, the waste sector is the second largest CH4 emitter after agriculture, so waste sector emissions deserve significant attention if we are to achieve the UK’s net zero targets.

The UK biodegradable waste strategy aims to divert progressively more waste from landfills into anaerobic digestion or composting facilities for recycling. Recent studies (Gua et al. 2020, Bakkaloglu et al. 2022a, Cusworth et al. 2020) indicate that anaerobic digesters and composting facilities can be a significant source of CH4 emissions, and our latest study aims to evaluate the UK’s biowaste strategy to better understand future CH4 emissions.

We use the term biowaste in this study to cover food and garden waste, because the broader term – biodegradable – encompasses a wider variety of wastes such as manure, sewage sludge, paper, cardboard and more. The objectives for our research were to compare the environmental impacts of biowaste treatment in the UK and to assess the effect of CH4 emissions. We considered four different waste treatment methods anaerobic digestion, composting, incineration, and landfill), as well as seven different scenarios for waste in various ratios treated using current and future waste management technologies. Full details of those scenarios are explained in full paper.

The four biowaste treatment methods assessed: anaerobic digestion; in-vessel composting; landfill; incineration with energy recovery. The dashed line indicates the system boundary and blue text indicates recovered resources.

In our latest study, we combined mobile CH4 emissions data for anaerobic digesters (AD) – rather than relying on the default emission factors for life cycle assessment (LCA). Approximately 19% of biowaste in the UK is currently landfilled, while 38% is incinerated. Of the remaining 53%, the waste strategy set a target for AD of 15% in 2020.  It is reasonable to assume that 15% of biowaste is sent to AD and the remaining 28% is sent to the composting facility. Combining the mobile methane emissions from AD and composting facilities, we can estimate that current annual UK average methane emissions are approximately 58.2 kilotonnes.

If we sent 90% of biowaste to AD and 1% to landfills as a strategy for the reducing landfilled biowaste by 2050, annual emissions would decrease to 30.3 kilotonnes. Therefore, sending more biowaste to AD can reduce emissions, but if we want to achieve net zero emissions from the waste sector, remaining emissions must be offset. Therefore, we recommend that future UK waste management policies should also focus on eliminating fugitive emissions from treatment technologies, especially AD, in order to achieve net zero emissions by 2050.

Biogas and biomethane emissions – a quick win for decarbonising future energy systems?

In our latest blog, Dr Semra Bakkaloglu reflects on our newly published research into biogas and biomethane emissions.

Over 100 years, methane has 27.2 times the global warming potential of carbon dioxide. So when it comes to climate change, it’s pretty potent stuff. Methane concentrations in the atmosphere are increasing, which makes it a quick-win target in the drive to decarbonise our global energy system.

It’s no coincidence that over 100 countries signed the Global Methane Pledge at COP26 in Glasgow. The pledge is a commitment to reduce methane emissions by 30% (from 2020 levels) by 2030. But a 30% reduction is ambitious, not to mention a complete reversal of the current trajectory of increasing methane emissions. Achieving that will require a combination of measures, which include reducing emissions from the existing supply chain whilst also reducing reliance on natural gas as a fuel by switching to cleaner energy alternatives, such as electrification or hydrogen.

But those new energy alternatives are at wildly different stages of technological readiness and require major infrastructure changes and investment. They are unlikely to happen overnight – and many are unlikely to become mainstream within the next 8 years.

One sector that is expected to grow and contribute to decarbonisation in that transition period is biogas and biomethane – a mixture of gases (mostly methane (CH4 and carbon dioxide (CO2)) produced from biodegradable materials. It’s a technology with a lot of factors in its favour: the volume of organic waste – known as feedstock – generated by modern societies is increasing, it provides a beneficial alternative disposal method for that waste, and conversion of energy from waste to biogas can begin to replace fossil fuel gas – which in turn reduces overall greenhouse gas (GHG) emissions. Ultimately it contributes to meeting those government commitments.

But biogas and biomethane production can also emit methane and it’s an area that’s been lacking in research. No study has assessed methane emissions from the biogas and biomethane supply chain – until now.

For our recent study, we synthesised methane emissions from the biogas and biomethane supply chains by breaking down stages and identifying key elements from direct measurements studies. We used a statistical model Monte Carlo approach to estimate aggregate methane emissions with uncertainty assessment, which can account for up to 343 g CO2-eq. We observed that biogas and biomethane supply chains exhibit similar emission characteristics to oil and natural gas with super-emitters present at all stages. In our study, 62% of the emissions come from just 5% of the point sources – these super-emitters waste a disproportionately large amount of methane

“..62% of the emissions come from just 5% of the point sources – these super-emitters waste a disproportionately large amount of methane.”

The International Energy Agency’s (IEA) inventory, (the only other benchmark data currently available) estimated total methane emissions from bioenergy to be 9.1 Tg in 2021.

Our study, which only looked at one aspect of bioenergy (biomethane), discovered that methane emissions are more likely to be in the range of 6.4 – 7.8 Tg per year (95th percentile), but the average methane emissions are around 2.8 Tg according to the IEA’s global biogas and biomethane generation rate 1.47 EJ in 2018. If biogas and biomethane production are expanded to the same scale as the oil and natural gas industries and no action is taken, they could emit almost 4 times as much methane as oil and gas supply chains (82.5 Tg in 2021). At present, our results indicate they are high – higher even than natural gas, which is clearly a worry.

Considering the latest IPCC-AR6-WG3 climate change mitigation scenarios that achieve the Paris Agreement 1.5°C temperature rise mitigation target with low or no overshoot, we can see that biogas and methane could have up to 28 EJ of production by 2050. Using our mean emissions rate (52.3 g CO2-eq per MJHHV) from this study, this would result in 53.8 Tg methane emissions. This drives home the point that it is extremely important to reduce biogas and biomethane emissions for these energy sources to play a constructive role in our future energy system.

Finding and removing these large emitters is a critical step toward significantly reducing overall emissions from biomethane and natural gas supply chains. It’s not just about controlling greenhouse gases either. There’s a significant economic argument for addressing emissions – all that lost gas has a commercial value.

According to the European Biogas Association (EBA), biomethane can be produced for as little as €55 per MWh, while natural gas costs around €80 per MWh. When our findings are combined with the cost of biomethane, we can calculate that emitting 2.8 Tg of methane per year in average (based on the IEA’s global biomethane and biogas generation rate for 2018) can result in an average a global economic loss of 2.4 billion euros in average.

“… emitting 2.8 Tg of methane per year can result in a global economic loss of €2.4billion in average.”

Through improved design, detection, measurement, and repair techniques, much of the observed emissions can be avoided. If we focus on super-emitters, there are some potential quick wins too. We found that the digestate stage and upgrading units need the most attention in this regard. There’s a lot of overlap with oil and natural gas supply chains too – preventing gas venting, reducing flaring activities and designing a closed unit with a vapour recovery system can all contribute to reducing emissions.

Additionally, we need better regulations, continuous emission measurements, and close collaboration with biogas plant operators in order to address methane emissions and meet the Paris Agreement temperature target.

We know what we need to do to tackle those emissions; the important thing is to get started right away. Biomethane is an important renewable energy source, but it could be even better! Combating biomethane emissions is not only significant for meeting Paris Agreement’s target but also boosting the global economy.

Hydrogen and other short lived climate pollutants – is the time horizon important?


Dr Jasmin Cooper, Research Associate here at Imperial’s Sustainable Gas Institute, shares the work being done to model the potential global warming impacts of H2 emissions in possible future supply chains.


Short lived climate pollutants are greenhouse gases which stay in the atmosphere for much less time than carbon dioxide (CO2). Despite this, they are much more powerful than CO2 and can trap as much heat as thousands of kilograms of CO2 on a mass-to-mass basis (Table 1).

Table 1: Properties of different greenhouse gases (Derwent, 2018, Derwent et al., 2001, Derwent et al., 2018, Derwent et al., 2020, Field and Derwent, 2021, Forster et al., 2021, Myhre et al., 2013, IPCC, 2007).
Greenhouse gas GWP over 500-year time horizon GWP over 100-year time horizon GWP over 20-year time horizon Lifetime in the atmosphere
Carbon dioxide 1 1 1 Hundreds of years
Methane 7.6 29.8±11 82.5±25.8 12 years
Black carbon 900±800 3,200 (+300/-2,930) A few weeks
Hydrofluorocarbonsa 435 1,526±577 4,144±1,160 15 years
Hydrogen 4.3 to 10 Four to seven years
afor the hydrofluorocarbon HFC-134a.

In recent years methane (CH4) has emerged as the most important short lived climate pollutant with the IPCC’s AR6 report finding that emissions of it must be cut for 1.5°C or 2°C temperature targets to be met (IPCC, 2021, McGrath, 2021). This is because it is, at present, the second most important greenhouse gas, being responsible for around 30% of global warming to date (McPhie, 2021). It is also the second most emitted greenhouse gas e.g. in 2019 the UK’s total greenhouse gas emissions were 80% CO2, 12% CH4, 5% nitrous oxide and 3% fluorinated gases (BEIS, 2021). As energy systems move away from fossil fuels, hydrogen (H2) could replace natural gas in areas that are difficult to decarbonise through electrification, such as heavy industry and heat.

H2 is a greenhouse gas, but unlike CH4 it is an indirect greenhouse gas. It does not absorb and trap heat but interferes with other (direct) greenhouse gases by enhancing their warming potential (Derwent, 2018). Therefore, in a world where H2 is used in a way akin to natural gas is now, there is the potential for H2 to be emitted into the atmosphere and contribute towards global warming. While there is limited literature available which estimates the impacts of it in the atmosphere, some as-yet to be peer reviewed research suggests short-term forcing from H2 could be higher than that of methane.

Here at the SGI, we have been modelling the potential global warming impacts of H2 emissions in possible future supply chains. When a 100-year time horizon is considered, H2 will likely not impose extra burdens to meeting Paris Agreement goals. However, if shorter time horizons and other climate metrics are considered, the impacts of H2 could be greater, as short-lived climate pollutants exhibit the majority of their warming impacts in the first few years of being emitted. This is an area where more research is needed, as it is important to fully understand the climate impacts of H2 if it is to become a key energy source.

Figure 1: Temperature response curve of various greenhouse gases (Myhre et al., 2013).

Whilst short lived climate pollutants are important, CO2 is still the most important greenhouse gas because its atmospheric lifetime is long (hundreds of years), and its warming effect is stable (Figure 1). Therefore, when comparing greenhouse gases and creating strategies to tackle global warming, it is important that attention not be drawn away from CO2 i.e. making large cuts to methane emission cannot be used as an excuse to slow down rates of decarbonisation. While short lived climate pollutants are important in the fight against climate change, caution should be used when pitting greenhouse gases against one another based on their GWP, especially GWP over 100-year horizons.

This could lead to unintended consequences either side. For example, a shift away from the importance of CO2 resulting in decarbonisation rates slowing down, or non-CO2 greenhouse gases not being given enough attention and consequentially little action being taken to mitigate emissions.

Overall, the time-horizon considered when comparing greenhouse gases to other another is important but what is more important is the quantity of greenhouse gases emitted. GWP is a useful metric to promote the importance of emissions abatement of non-CO2 greenhouse gases, but its importance becomes less pronounced when emissions are vastly reduced.


References 

BEIS. 2021. 2019 UK Greenhouse Gas Emissions, Final Figures London, UK; Department for Business, Energy and Industrial Strategy (BEIS). Available:’ https://assets.publishing.service.gov.uk/government/uploads/system/uploads/attachment_data/file/957887/2019_Final_greenhouse_gas_emissions_statistical_release.pdf

Derwent, R. 2018. Hydrogen for heating: atmospheric impacts – a literature review London, UK; Department for Business, Energy and Industrial Strategy (BEIS). Available:’ https://www.gov.uk/government/publications/atmospheric-impacts-of-hydrogen-literature-review

Derwent, R. G., Collins, W. J., Johnson, C. E. & Stevenson, D. S. 2001. Transient Behaviour of Tropospheric Ozone Precursors in a Global 3-D CTM and Their Indirect Greenhouse Effects. Climatic Change, 49, 463-487. 10.1023/A:1010648913655

Derwent, R. G., Parrish, D. D., Galbally, I. E., Stevenson, D. S., Doherty, R. M., Naik, V. & Young, P. J. 2018. Uncertainties in models of tropospheric ozone based on Monte Carlo analysis: Tropospheric ozone burdens, atmospheric lifetimes and surface distributions. Atmospheric Environment, 180, 93-102.

Derwent, R. G., Stevenson, D. S., Utembe, S. R., Jenkin, M. E., Khan, A. H. & Shallcross, D. E. 2020. Global modelling studies of hydrogen and its isotopomers using STOCHEM-CRI: Likely radiative forcing consequences of a future hydrogen economy. International Journal of Hydrogen Energy, 45, 9211-9221. https://doi.org/10.1016/j.ijhydene.2020.01.125

Field, R. & Derwent, R. 2021. Global warming consequences of replacing natural gas with hydrogen in the domestic energy sectors of future low-carbon economies in the United Kingdom and the United States of America. International Journal of Hydrogen Energy.

Forster, P., Storelvmo, T., Armour, K., Collins, W., Dufresne, J. L., Frame, D., Lunt, D. J., Mauritsen, T., Palmer, M. D., Watanabe, M., Wild, M. & Zhang, H. 2021. The Earth’s Energy Budget, Climate Feedbacks, and Climate Sensitivity. In: Climate Change 2021: The Physical Science Basis. Contribution of Working Group I to the Sixth Assessment Report of the Intergovernmental Panel on Climate Change Cambridge, UK and New York, USA; Cambridge University Press. Available:’ https://www.ipcc.ch/report/ar6/wg1/downloads/report/IPCC_AR6_WGI_Full_Report.pdf

IPCC. 2007. Climate Change 2007: The Physical Science Basis. Contribution of Working Group I to the Fourth Assessment Report of the Intergovernmental Panel on Climate Change, Cambridge, UK and New York, USA; Cambridge University Press. Available:’ https://www.ipcc.ch/site/assets/uploads/2018/05/ar4_wg1_full_report-1.pdf

IPCC. 2021. AR6 Climate Change 2021: The Physical Science Basis, Geneva, CH; Intergovernmental Panel on Climate Change (IPCC). Available:’ https://www.ipcc.ch/report/ar6/wg1/

McGrath, M. 2021. Climate change: Five things we have learned from the IPCC report. BBC News.

McPhie, T. 2021. International Methane Emissions Observatory launched to boost action on powerful climate-warming gas [Press Release]. Brussels, BE. Available: https://ec.europa.eu/commission/presscorner/detail/en/IP_21_5636.

Myhre, G., Shindell, D., Bréon, F. M., Collins, W., Fuglestvedt, J., Huang, J., Koch, D., Lamarque, J. F., Lee, D., Mendoza, B., Nakajima, T., Robock, A., Stephens, G., Takemura, T. & Zhang, H. 2013. Anthropogenic and Natural Radiative Forc- ing. In: Climate Change 2013: The Physical Science Basis. Contribution of Working Group I to the Fifth Assessment Report of the Intergovernmental Panel on Climate Change, Cambridge, UK and New York, USA; Cambridge University Press. Available:’ https://www.ipcc.ch/site/assets/uploads/2018/02/WG1AR5_Chapter08_FINAL.pdf

Does gas hold a future with the Paris climate targets?

Face
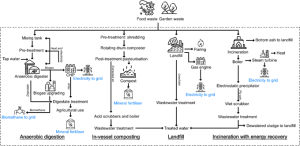
Leonie Marie Emilie Orhan is a student on the MSc Sustainable Energy Futures course at Imperial College. She previously did her undergraduate at the University of Warwick in Mechanical Engineering. Leonie wrote a summary blog post about the latest white paper, ‘Best uses of natural gas within climate targets’ and launch event.

The sixth white paper from the Sustainable Gas Institute ‘Best uses of natural gas within climate targets’ focuses on the future uses of natural gas within the 1.5°C Paris climate targets for both 2050 and 2100. Through the analysis of different gas use scenarios (and energy mixes) from the Intergovernmental Panel on Climate Change (IPCC), it highlights the uncertainties in the future use of natural gas and highlights the potentials of Carbon Capturing and Storage (CCS) and of hydrogen in decarbonisation. It also focuses on the impact policies have on the development and growth of these industries through investment attractivity.

The presentation (watch the launch video) was hosted by the author, Dr Jamie Speirs, a Research Fellow at the Sustainable Gas Institute and the Centre for Environmental Policy, and co-authors, Luke Dubey, a Research Assistant at the Sustainable Gas Institute, and Naveed Tariq, a PhD Researcher from the Department of Chemical Engineering at Imperial College London.

Gas use differs across regions

It is evident that natural gas usage must be reduced not only to attain the 1.5°C targets, but also to conserve fossil fuel reserves for applications which do not yet have viable substitutions. A large majority of the scenarios agree with this, with large variations in different regions. The report shows that Europe’s consumption is set to drop rapidly through substitutions to greener solutions, while in Asia, natural gas would increase until 2050 (before decreasing) due to a growing middle class which relies on affordable energies. I found that highlighting these differences brought light to the individuality of solutions required if they are to consider not only the environmental perspective, but also the social and economic facets.
The importance of carbon capture and storage


Natural gas use was also shown to decrease significantly faster without carbon capture and storage (CCS) than with CCS. This demonstrates that to meet the 1.5°C targets while allowing a more significant transition period to other more sustainable energies, CCS must develop quickly. However, CCS development is controlled by economic incentives and policies as these are needed to be in place to draw in investments to enable the growth of the CCS industry.

Natural gas and hydrogen

In sectors for which decarbonisation is more difficult, such as domestic heating or transport, hydrogen could provide a substitute for the use of natural gas. Currently, hydrogen can be separated into blue and green hydrogen: blue hydrogen is produced using natural gas and green hydrogen using renewable energies. Due to the high costs of green hydrogen production, blue hydrogen is currently more favourable to the economy. Although its production does contribute to greenhouse gas emissions, its growth is necessary to pave the way for green hydrogen. This is due to the infrastructure needs of hydrogen production, storage, and distribution.

The UK government has stated in its recent Hydrogen strategy that both CCS and hydrogen will be essential to decarbonisations with notable milestones based on an increase in hydrogen production (1GW by 2025 and 5GW by 2030), an increase in CCUS clusters (2 by 2025 and 4 by 2030) and hydrogen heating and hydrogen town trials in 2025 and 2030. This shows a\strong interest from the government in these economies, as the UK seeks to transition quickly to enable a strong economic growth.

The White Paper points out that the scenarios analysed are based on the current knowledge of greenhouse gas emissions, which lacks an understanding of methane global warming potentials and may be affected by other factors in the future. This points out the need for a regular analysis and updated predictions and shows that there could be discrepancies between the scenarios presented and the future.

One of the main points I feel was conveyed in the report and presentation was the lack of policies to incentivise the growth of CCS and hydrogen production, which have the potential to play large roles in reaching the 1.5°C targets. Policies would need to centre around the development of the infrastructures required, the realignment market regulations to meet the demands of CCS and hydrogen, and agreements for international trade of hydrogen.The differences in hydrogen demand depending on how strong policies were really illustrated these points, with few and weak policies resulting in a demand over three times smaller than for strong ones, while with policies whose strengths and numbers are at a theoretical maximum, the demand came close to twice that of strong policies.

Expert views on the report

Dr Susana Moreira, a Senior Gas Specialist at The World Bank, offered a commentary which outlined the importance of investing in more electricity grids to cope with the demand and ease the changes in economy required to pave the way to a net zero future. Another pertinent point was that of connecting everyone to the grid and the adjustment that gas producing countries would have to make, not only to their electricity structures, but also to their economies. The impact of hydrogen production to the environment and communities was also pointed out. Overall, her commentary brought light on economic, social, and environmental issues which are key factors in the consideration of a net zero future.

Martin Lambert, a Senior Research Fellow at the Oxford Institute for Energy Studies, focused his commentary on emphasising the need of investments and policies required to do so.

Overall, the paper shows that to meet the 1.5°C targets, CCS and hydrogen must benefit from policies to encourage investments and regulations to direct the market as meeting the targets requires reliance on CCS and hydrogen. I feel more emphasis should have been placed on the idea that although the population is projected to increase to over 10 billion by 2100 (UN Population Facts, December 2019) natural gas usage is predicted to decline.

What are the best options for road freight transport?

Pedro Gerber Machado, a visiting researcher from the University of São Paulo, Brazil, summarises his recent review paper examining the life cycle emissions for road freight transport. The review was carried out in collaboration with the Institute of Energy and Environment at the University of São Paulo, Brazil.

Author: Pedro Gerber Machado

The transport sector is responsible for around 30% of the world’s energy consumption and 16% of greenhouse gases (GHG) emissions.  To achieve an energy transition to guarantee net-zero emissions, reducing emissions from road transport is fundamental. Diesel is still the most common fuel used for heavy road transport and freight. While worldwide there is a move towards electric vehicles, their environmental benefit in reducing emissions depends on the area’s electricity sources. Our review paper examines the total environmental life cycle emissions of different fuel options and technologies for road freight transport (trucks) in 45 studies.

Electric vehicle
Source: Pixabay

Source of electricity

The source of electricity can make a big difference to greenhouse gas emissions. We found that with greenhouse gas emissions, higher values (3,148–3,664 g/km) are found in places where coal has a significant share in electricity generation. Lower emissions are found where renewables have higher percentages in electricity generation (496 g/km). In China, emissions can reach 5,479 g/km since electricity generation “is mostly from coal.”

Compressed Natural Gas (CNG)

For Compressed Natural Gas (CNG) technology, greenhouse gas emissions vary due to differing efficiency and assumptions about methane leakage during natural gas transportation. But future projections are optimistic due to the potential for improvements in controlling methane emissions (514 g/km in 2050).

Biodiesel

In the analysis, biodiesel had a higher energy consumption and higher emissions profile in the production phase equal to diesel, which is the main reason for its low environmental performance.

Hydrogen

The greenhouse gas emissions intensity from hydrogen varies as it is depends on its method of production such as coal gasification, steam methane reforming (SMR), and hydrolysis. The use of carbon capture and storage (CCS) and liquid or gaseous use also influences its final emission profile.

Fuels vs. diesel

On average, the review showed that biogas, fuel-cell hydrogen, and Liquefied Natural Gas (LNG) have lower emissions in their life cycle than diesel, with a chance of a 57% reduction in emissions for biodiesel, 77% for fuel-cell hydrogen, and 100% chance for biogas. Interestingly, even though biodiesel is a renewable source of fuel that receives significant attention due to its capacity to reduce greenhouse gas emissions, in our review, it had a higher average emission than diesel.

Electric car
Source: Pixabay

Battery electric, hydrogen fuel cells and biogas

We found that if a clean electricity matrix is available, with high renewable energy shares, battery electric vehicles provide the best option. Hydrogen fuel-cells, when hydrogen comes from renewable sources, are also comparable to battery electric vehicles. Biogas can serve as a feedstock for hydrogen production in substituting natural gas in steam methane reform or liquefied for use in Liquid Natural Gas (LNG) trucks.

Further research into biogas emissions, fuel consumption, and its economics is essential. Since biogas production is possible from several sources, it could be suitable for different countries, such as Brazil.

Analysing air pollutants

There is a lack of studies exploring the life cycle of these options when it comes to air pollutants. Even though pollutant emissions in the use phase (for internal combustion options) have received more attention from the scientific community, emissions for the whole life cycle should also be studied. Even so, uncertainties related to the Tank-to-Wheel evaluation can increase the inaccurate values from this side of the analysis and the error propagation, directly impacting the policymakers. For PM2.5, hybrid and LNG options have greater changes in reducing the emissions. Fuel-cell, LNG, CNG, and hybrid trucks have higher chances of reducing nitrogen oxide (NOx) emissions. In contrast, sulphur oxide (SOx) emissions came out inconclusive due to a lack of studies.

But what about the economics…

CNG, LNG, and hybrid trucks were the best options from an economic perspective. CNG has lower life cycle costs and fuel costs in most analyses, with values ranging from 50% lower life cycle costs than diesel to a 2% reduction, to 16% average increase. CNG is the most economical fuel for large fleets that conduct urban operations and can support private infrastructure.

LNG could have a payback time of 2.5 years or lower, considering the price differential mostly in long-haul operations due to its lower fuel costs. However, economic viability could be achieved due to the higher cost of LNG vehicles and maintenance and the limited range of LNG trucks relative to diesel. The studies also showed that the fuel efficiency in LNG trucks could dictate its economic viability. Relative efficiencies of less than 80% reduce the chances of lower costs by 50%.

Finally, hybrid trucks show a total life cycle cost from 10% lower to practically no difference. Although the incremental cost of hybrid trucks is expected to become close to zero in the future, additional investments of more than $35,000 in hybrid technology hinder its viability, especially with low diesel fuel costs.

In the developing world…

The question arises then if the best options regarding GHG and local pollutant emissions will ever be a possibility for developing regions. Even though authors point out that electric trucks could cause an increase in emissions in several places in the world and that it is still necessary to evaluate peak power demand to understand the operational aspects of transport electrification, electric trucks in countries with a high share of renewables have the most radical reductions in GHG. However, being the most expensive options, there is a slight chance that governments in poorer countries or even the private sector will be willing to pay the price, based solely on environmental reasons.

The way to go in these countries has been to continue to depend on diesel. Most recently, the discussion on natural gas use in the transport sector has gained some momentum. Cheaper than other alternative options, natural gas might be an option due to its lower PM emissions, even though other pollutants, or GHG emissions, are higher.


Exploring ways to decarbonise heat in Chilean cities

Jorge Salgado Contreras

Chile is committing to decarbonising its electricity sector with a target of 60% renewable power by 2035, but there are still some challenges with decarbonising the heat sector. Chileans still rely heavily on natural gas to heat their homes. Jorge Salgado Contreras from Chile, visited the Sustainable Gas Institute for two months, funded by the Chilean National Commission for Science and Technology, and tasked with investigating ways of developing heat decarbonisation pathways for cities in Chile. We interviewed Jorge about his research.

What is your background?  

I am an industrial engineer and now Head of the Electrical and Electronics Department at Inacap in Punta Arenas University, Chile. I have combined experience in the energy sector, working in academic, private and public sectors. In the private sector, I have worked for both the national gas retailer (Intergas Inc) on both business development and the technical side, as well as in an energy start-up. I also worked for the Ministry of Energy of Chile, on renewable energy and energy efficiency projects, where I was in charge of cogeneration initiatives and lead the long-term energy plans for two cities in Patagonia.

How did you find out about the Sustainable Gas Institute, and what first sparked your interest in working here?

I found the Sustainable Gas Institute website, and it was actually the name that first caught my attention. I really liked the aims of the Institute as it is clear we cannot move to 100% renewables straight away, and a transition is necessary. I also thought the White Paper Series is really trying to address some unresolved issues. Even though the reports are written by academics, they are very influential from a policy context.

The energy mix in Chile (Source: Ministry of Energy, Chile).

Your project is to understand how to decarbonise heat for Chile. Can you tell us why it’s so important an issue?

Chile is actually very cold, especially the southern end which is where I am from; it can go below -10 °C. While Chile has ambitious climate targets to increase renewables to 70% by 2050, these targets have only been set for the electricity sector and there are little targets, plans or research taking place to reduce the emissions intensity of the heat sector.

We currently use so many energy to heat our homes in Chile.  Fortunately, Chile does have a good renewables portfolio (22% renewables),  increasingly with solar and wind. However, in my region (Magallanes and chilean Antarctica, Chile), we still use natural gas to heat our homes, as you do in the UK. We do have access to our own natural gas and biomass but in other regions, for example in Southern Chile, natural gas is imported from overseas. The natural gas subsidy for residential and commercial use in the Magallanes region is around 100 million US$/year and represents about 70% of the Chilean Ministry of Energy National Budget.

What is the project about and who have you been working with?  

I have been trying to understand whether we can work with low-carbon options such as hydrogen to decarbonise the existing gas grid infrastructure. In Chile, there is not much research taking place to understand the role of hydrogen in heat decarbonisation.

I have also been looking at the use of electrification and technologies, such as heat pumps. The recent report by the UK Committee on Climate Change into this was very useful as a case study. The idea is to adapt for the Chilean context, and we could move forward towards a low carbon economy by replacing natural gas with hydrogen.

At the Institute, I have been mainly working with both Dr. Paul Balcombe (an expert in the supply chain for hydrogen) and Dr. Francisca Jalil Vega  (who is highly knowledgeable about various heat decarbonisation options).

And finally, have you enjoyed your time at Imperial College? What do you plan to do next?

Map of Magallanes and Chilean Antarctica Region (Source: Wikimedia Commons)

I am hoping to publish a paper with Francisca and Paul, and I will continue working on this during the coming months. I might be speaking in a congress and will present my work to the Ministry of Energy in Chile.

It has been great working at Imperial College because it such a world-class international university and I really like the interdisciplinary environment. There are so many people doing relevant research here!


Read Jorge’s biography on the Sustainable Gas Institute website.

Header Photo: Picture of Torres del Paine in Patagonia in Chile (Source: Pixabay).

VIDEO: My research in a nutshell – Sandro on reducing industry emissions

How to reduce emissions from industry?

By the time you finish your masters, you’ll know your thesis inside out. We challenged one of our researchers at the Sustainable Gas Institute to explain their research in a short one minute video as part of the ‘Research in a Nutshell Series’.

Sandro Luh is a visiting Masters student from the ETH Zurich. He is using the MUSE energy systems model to examine the potential of different strategies for reducing CO2 emissions in the industrial sector. This includes measures such as fuel switching, electrification and Carbon Capture & Storage.

The industrial sector is a key sector to decarbonise as it accounts for 24% of the total global CO2 emissions (2014).

If you want to find out more about Sandro’s work, read our short interview with him.