Blog posts

Methane origins part III – the Relentless Rise of Methane

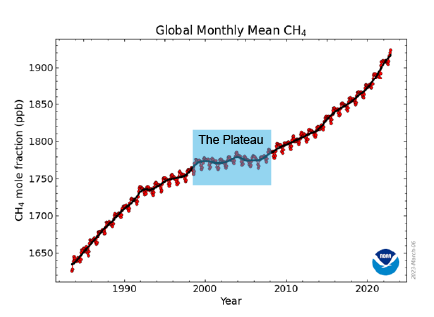
In Methane origins part two we pondered the methane plateau of the early noughties.  For part three the Sustinable gas Institute’s Dr Semra Bakkaloglu looks at what has happened since, and where the science points in figuring out the relentless rise in the concentration of methane in Earth’s atmosphere.


Methane concentrations are a two-way street. We know that the rise in the mole fraction (the measure of concentration in the atmosphere) for the gas can be attributed to two things; changes in the relative amounts and totals of emissions from biogenic, thermogenic, and pyrogenic sources, or its destruction through natural methane sinks – Nisbet et al., 2019.

So, which is it – is more being produced? Or is less being destroyed? It is an important question, because – as Nisbet et al also pointed out – the accelerating increase in concentration is enough to push us past Paris Agreement target limits.

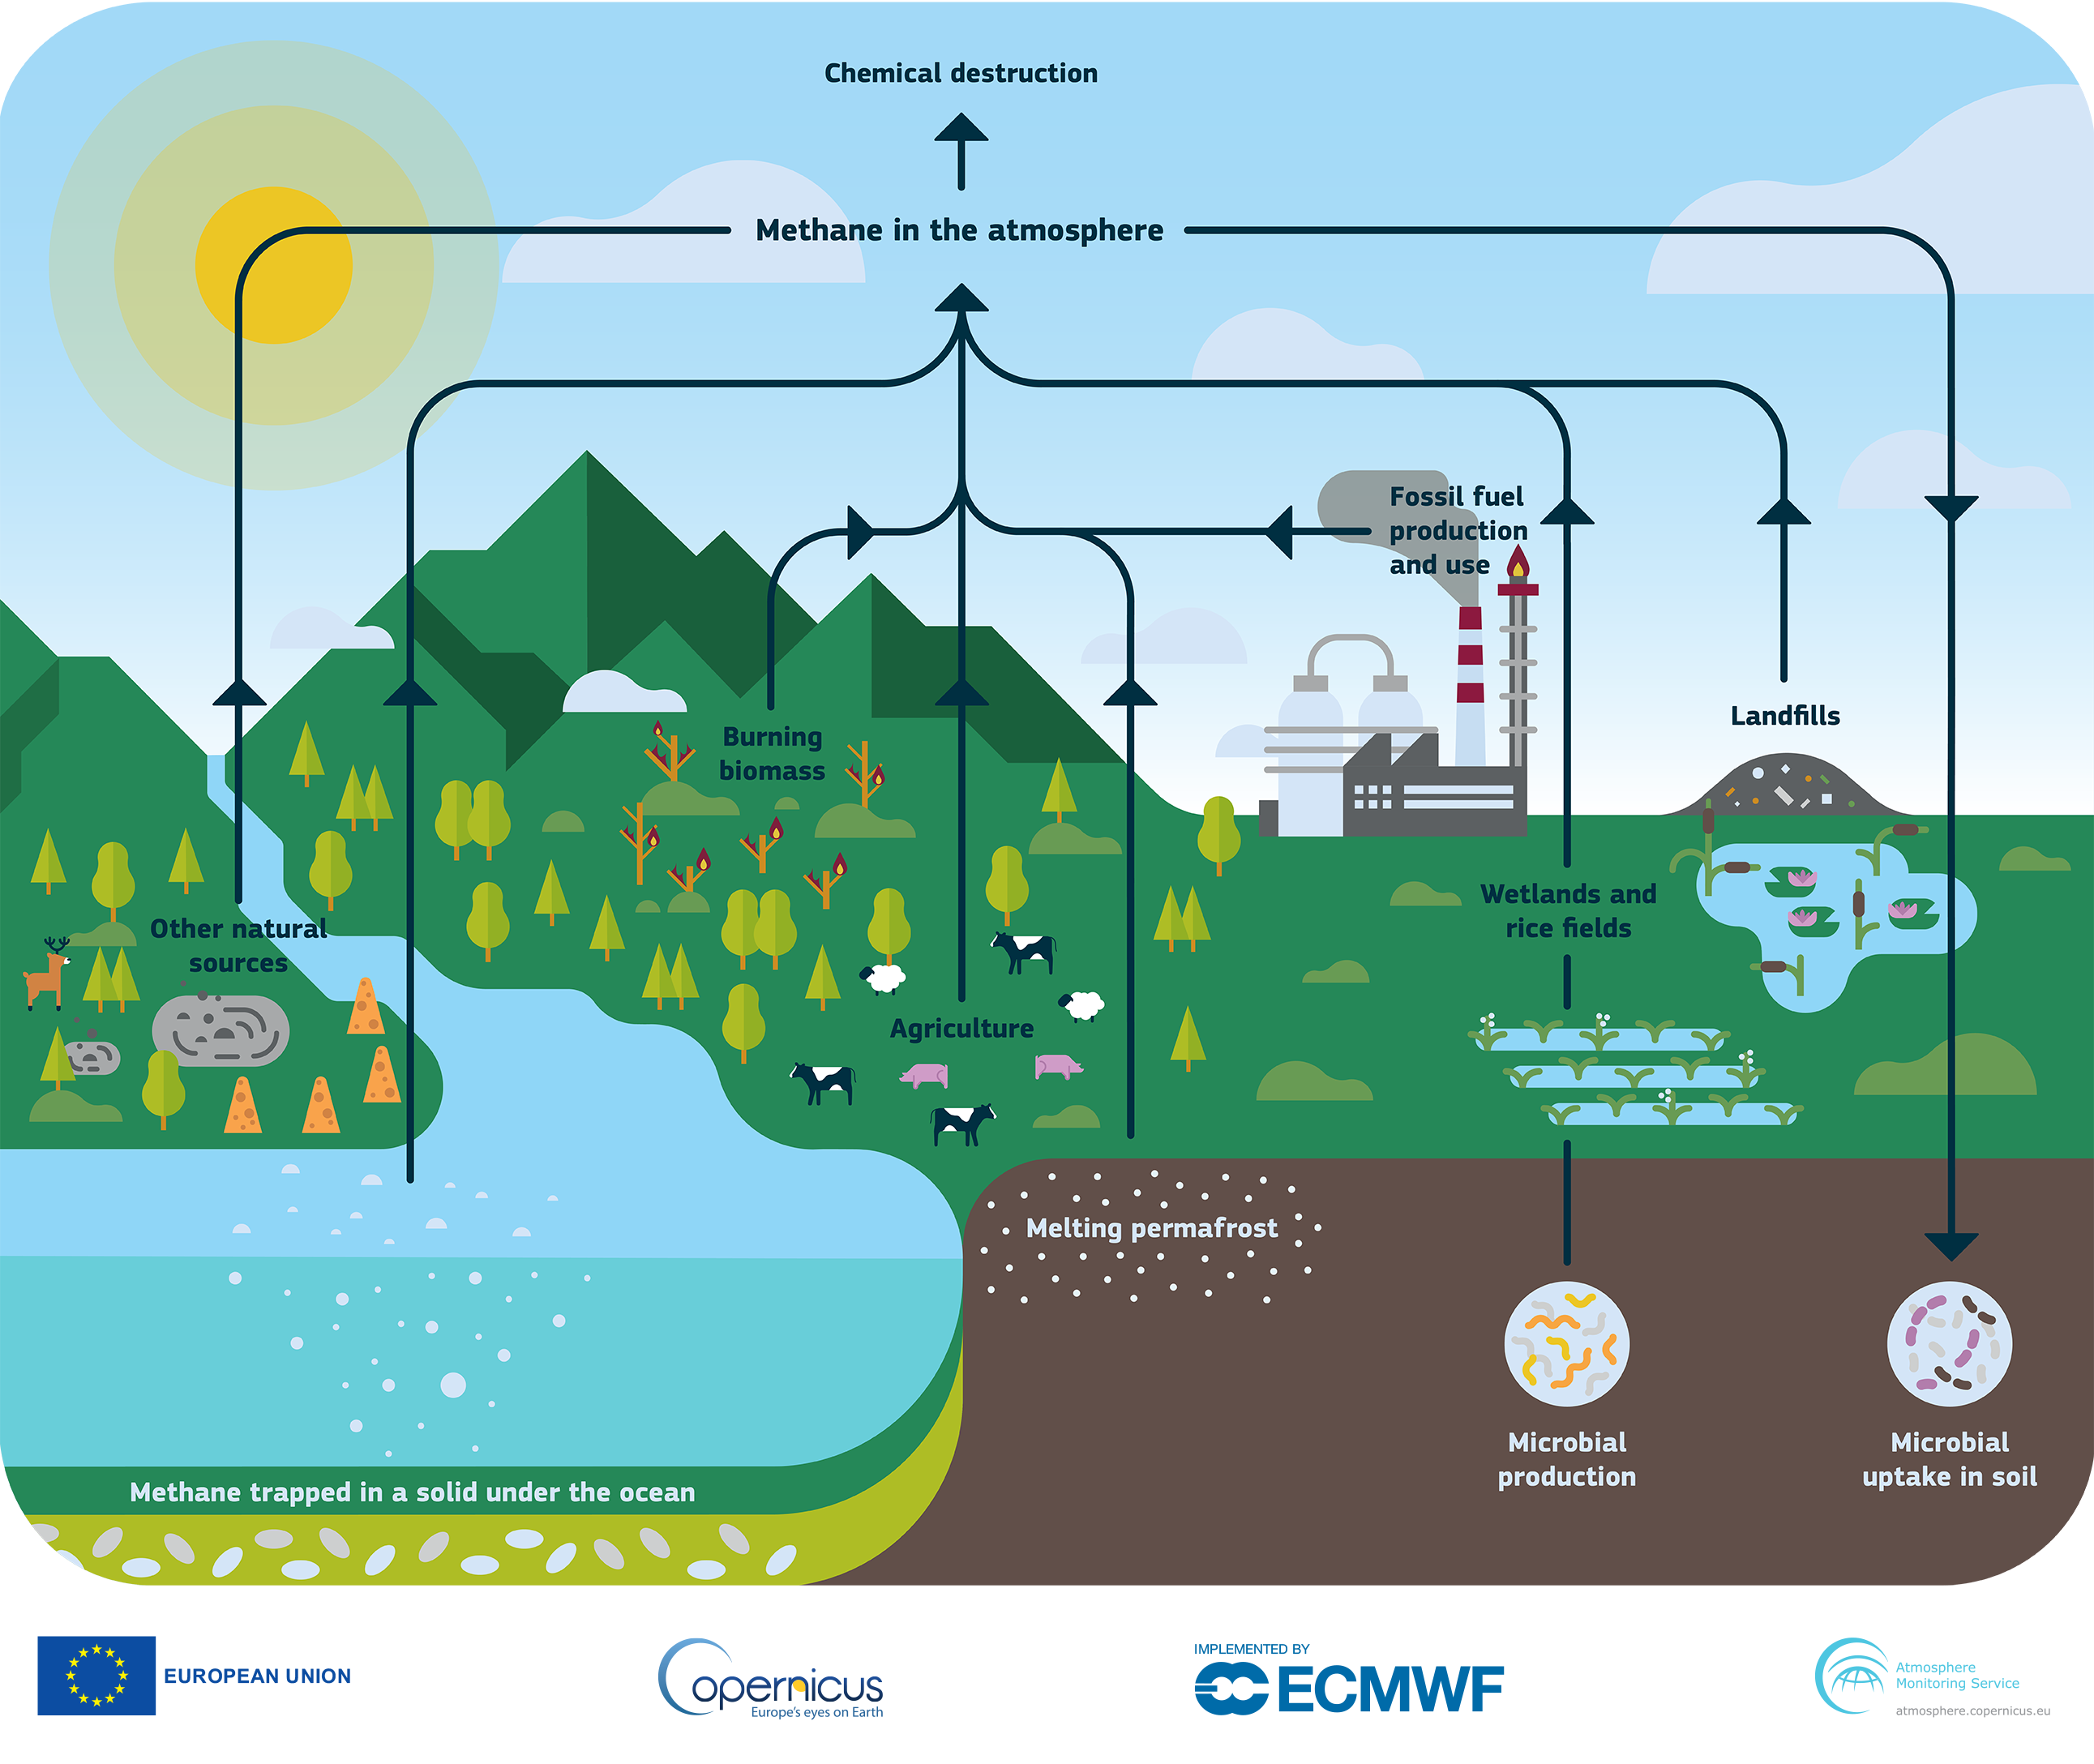
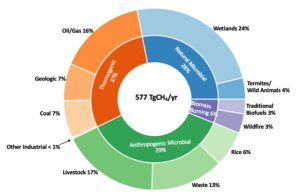
Unfortunately, that’s not easy to answer – the Methane cycle (fig 1) is a complex thing.

Fig 1: The methane cycle. Credit: Copernicus Atmosphere Monitoring Service, ECMWF.


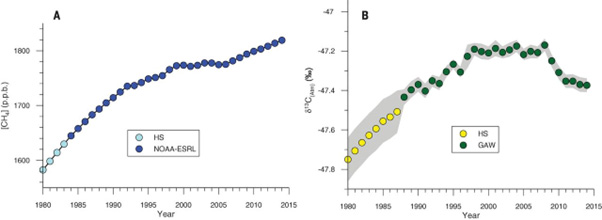
So – remember part I? If you don’t, here’s a quick refresher on isotopic δ 13C – CH4 source signatures.  To better understand the methane origins –  the δ 13C – CH4 are defined as:

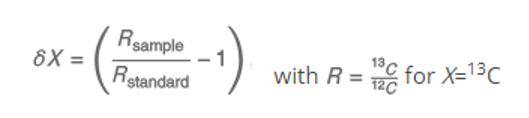
δ values are reported in per mille (‰), relative to the international standard materials Vienna Peedee Belemnite (VPDB) for δ13C.

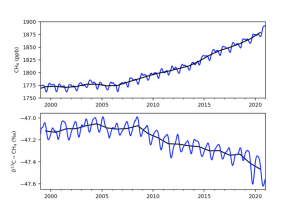
So let’s investigate the research to see what scientists say about the increase in atmospheric methane concentration after 2006.

A 2022 study by Drinkwater et al examined satellite remote sensing data which suggested both – evidence of lighter atmospheric methane isotopic signature changes (which tend to indicate increasing natural emissions), coupled with a decrease in destructive rate via Hydroxyl radical (OH) sink mechanisms.

But in 2021 Zhang et al argue that anthropogenic emissions are responsible for atmospheric methane increases as current process-based wetland CH4 models cannot explain the fact that a significant rise in emissions from natural wetlands caused a decrease in atmospheric δ 13C – CH4 values.

If we are considering increasing anthropogenic emissions from biogenic sources, it is important to focus on livestock emissions since they are the largest source in the global methane budget. Research by Chang et al in 2019 suggests that ruminants’ enteric emissions played a larger role in the observed decline of δ13C in atmospheric methane from 2000 to 2012.

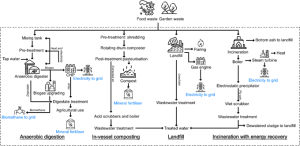
In my own paper, we examined waste source signatures and reported that the isotopic signature of CH4 – sourced from biogas plants and active landfills – exhibits more significant reductions in the 13C isotope compared to CH4 obtained from other waste sources.

We also know that governments are adopting the practice of diverting biowaste away from landfills towards anaerobic digestions, which is a beneficial strategy for mitigating methane emissions. These might explain the rise in CH4 mole fractions with a lighter isotopic signature.

So, what about the contribution of oil and gas emissions to increasing atmospheric methane levels? The methane isotopic signature being lighter suggests a decrease in oil and gas emissions. But recent International Energy Agency (IEA) data contradicts that. Methane emissions from the oil and gas sector have been increasing – so either the industry is getting very good at tackling supply-chain emissions, or we need to question whether we are missing something and investigate how the isotopic signature of methane from the oil and gas sector has been evolving.

A study in 2022 by Menoud et al supports that theory, reporting that the fossil fuel source signature could have been more depleted (more negative, lighter) in recent years.

Overall, it is evident that a great number of factors are responsible for the increase in atmospheric CH4 with a lighter isotopic signature. It is crucial to note that the atmospheric chemistry of methane is highly complex, and the main source of uncertainty when using δ13C data to distinguish between different methane sources, especially in methane sink mechanisms, as observed by Basu et al in 2022.

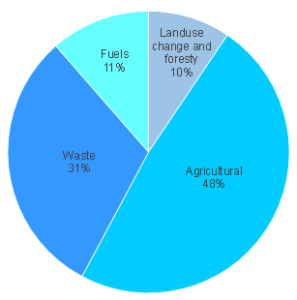
It is not going to be a clear-cut answer, but a plausible explanation includes the rise in emissions from agriculture and waste as well as fossil fuels with possible contributions from wetlands and a weakening sink. But we need significantly more observations to completely understand the global CH4 budget and key atmospheric processes in order to reduce the uncertainties associated with δ13C data in methane source differentiation.

Methane origins – part II: The millennium methane plateau and post-plateau rise

At the end of part 1, we touched upon how at the turn of the millennium and through the first half of the noughties, scientists working in emissions monitoring observed a plateau in what had been steadily increasing atmospheric methane concentrations. It was a phenomenon very much against the expected trend and the reasons behind it still generate scientific debate and controversy. So for part 2 of our methane origins story, Dr Semra Bakkaloglu turns ESI (Emissions Scene Investigator) to cast a magnifying glass over the evidence, and offers her perspective on what caused the plateau, and what’s been happening since


Since the beginning of the industrial revolution, the concentration of atmospheric methane has increased around threefoldWe know this from a variety of scientific research efforts, including analysis of air trapped in ice cores which can be mapped to specific time-frames and the establishment, since 1983, of modern sampling and monitoring programmes for atmospheric methane concentration. This accumulation of data has corroborated an upward trend that was largely unabatedThat was until 1999 when the increase abruptly stopped.

It wasn’t a short pause either. This plateau – where atmospheric methane concentrations more or less remained constant – went on for seven years. Only in 2006 was ‘normal service resumed’ and the relentless increase in concentration recommenced.

Fig 1 – CH4 trend: This graph shows globally-averaged, monthly mean atmospheric methane abundance determined from marine surface sites since 1983. (NOAA Global Monitoring Laboratory)

So was something, somewhere, absorbing the methane? Was it being degraded at a faster rate? Was it that we were producing less methane from anthropogenic sources such as agriculture or oil and gas production? Or had natural biogenic methane sources, for some reason, gone into decline?

The 7-year plateau and renewed growth since have been the subject of conflicting explanations in the literature.

Dlugokencky et al. (2003) suggest that the stabilisation may be a new steady state for atmospheric methane, and it is the renewed growth that is anomalous.

Others argue the increase in methane concentrations has continued for more than a decade, indicating that the plateau period from 1999 to 2006 could be seen as unusual (Turner et al. (2017)).

That leaves us with an intriguing question – which is the anomaly? The relentless growth since 2006 or the stable period of plateau.

So the focus of research should be on explaining the anomalous stabilisation period and identifying the sources of emissions that contribute to the continued rise of methane after stabilisation period. 

Scientists turned to carbon isotopes (which we explored in part 1) to try and understand exactly what had stopped the increasing concentration in its tracks. After all, if we can understand why, we might be able to put that to use in a technology that allows us to influence methane concentration levels.

Let’s start with the isotopic ratios. We know that different proportions of carbon isotopes provide a signature for the source of methane. The pattern of 13C enrichment (less negative, heavier), along with a stable d13C, corresponds to the trends in methane concentration until the end of the 1999 and 2006 plateau (see Fig.2).

Fig 2. Global trends in methane mole fraction (A) and it isotopic signature (B) (Taken from Schaefar et al. (2016)

Post-plateau, there is an increase in the concentration of methane, accompanied by a depletion of 13C in the δ13C. This implies that the emissions before and after the plateau have different δ13C values.  

Various studies have suggested different explanations for the plateau in the 2000s and the growth of atmospheric methane since.

Decreased microbial methane production?
Kai et al. (2011) suggest that reduced growth rate can be explained by decreased microbial sources based on isotopic analysis.

A more active methane sink?
On the other hand, studies including methyl chloroform measurements indicate that changes in the methane sink played a role in both stabilisation and subsequent (Turner et al. 2017; McNorton et al. 2016). Turner et al. (2017) suggest that an explanation for the stabilisation is that the OH sink has increased, which has offset the increase in methane emissions.

A reduction in biomass burning?
Worden et al. (2017) used carbon monoxide measurements to suggest a decrease in biomass burning emissions (more enriched in 13C), which could explain the potential increase in both fossil fuel and microbial emissions.

A reduction in emissions from Oil and Gas?
Chen and Prinn et al. (2006) argue that fossil fuel sources decreased, a view backed up by Schaefar et al. (2016) 10 years later – that the plateau in methane levels can be attributed to reduced oil and gas production and investment into updating oil and gas infrastructure – largely a result of the collapse of the Soviet Union in 1992. This study qualified that  The plateau in methane  mole fraction could be due to variations in the hydroxyl methane sink alone, or it could be a combination of variations in the hydroxyl methane sink and reduced fossil fuel emissions.

There’s some important corroborating evidence here too; measurements of atmospheric ethane (almost solely a biproduct of the oil and gas sector) also showed a decline. Simpson et al. (2012) showed that global ethane emission rates declined from 1984 to 2010.

It can now be affirmed that the reduction in natural gas venting and flaring in oil fields contributed to this decrease, rather than a reduction in biofuel usage or biomass burning.

Chen and Prinn et al. (2006) reported an increase in emissions from rice and biomass burning, and suggested that a decrease in the energy sector could be the reason for the plateau. However, the evidence suggests that the reduction in fossil fuel emissions had a greater impact. It’s an observation that also clarifies why the isotopic signature remained unchanged during this interval – since rice emissions are depleted, and biomass burning emissions are more enriched than fossil fuel emissions.

Whilst isotopes are useful, the scientific toolkit for measuring slight and long-term changes in individual methane source strengths doesn’t yet allow us to accurately forecast future atmospheric methane levels with certainty.  New tools could help us improve our understanding in the sharp growth in methane concentrations since 2006 – and to examine that – you’ve guessed it – we’re going to need another blog!

Methane – an origin story

Emissions from fossil fuels or biological sources, a decrease in the atmosphere’s ability to break down methane or something else? The emissions work of the SGI relies on data that uses advanced chemical science to enable the identification of methane from different sources. In part one of a two-part blog, Dr Semra Bakkaloglu from our emissions team, explains the atomic-level forensics that scientists use to determine where methane came from.


The SGI’s work on methane emissions is important for understanding how governments and industries involved in energy supply chains can reduce emissions of this very significant greenhouse gas (GHG).  

Our research focuses on methane emitted from natural gas, biogas and hydrogen supply chains. These are anthropogenic sources of methane; neither would be a significant problem without the human ingenuity that created their supply chains. To do our research, we need to be sure the sampling and monitoring data we use has distinguished correctly between naturally occurring methane such as that from wetlands – and anthropogenically induced emissions such as from livestock farming and energy supply chains.

But surely methane is just methane, right? CH4 – an odourless, invisible, flammable gas made up of one carbon atom, bonded to four hydrogen atoms. Where do you start to tell the difference between methane that has bubbled up from the swampy depths of decomposing wetland and fossil methane that has propelled itself to freedom through a leaky flange in a 50-year-old natural gas pipeline?

Fig 1 A plausible CH4 emissions budget ca. 2015 based on Lan et al., 2021 that is in agreement with both observed atmospheric CH4 and 13CH4 (given in Fig 2). Atmospheric methane grew by 10 ppb in 2015 implying a global atmospheric chemical sink of 548 TgCH that year (Lan et al., 2021; NOAA, 2021 Picture taken from NOAA, 2022)

To calculate that – and arrive at a chart such as fig. 1 – the answer lies in the number of neutrons. Methane isotopes are variations of the methane molecule that have a different number of neutrons in their atomic nuclei. Tracing the sources and dynamics of methane in the environment involves using the specific characteristics of these isotopes to identify where the methane came from and how it is behaving. This is done by analysing the ratios of different isotopes in a sample and comparing them to known ratios from each specific source.

The most common methane stable isotope is carbon-12 (C12), which has 6 protons and 6 neutrons, and carbon-13, the heavier isotope; as well as hydrogen isotopes such as H-1 or H2 (deterium, denoted as D). Each CH4 source exhibits different partitioning of light (12C or H) and heavy (13C or D) isotopes of carbon and hydrogen, so 13C/12C or D/H. This provides the “DNA” for us to determine the source.

By carefully calculating the ratio of the most prevalent form of carbon, carbon-12, and its stable isotope, carbon-13 (13C), which has an extra neutron, we can determine the origin of the carbon in a methane sample.

13C is a tiny bit heavier than 12C.  Methane produced by microorganisms in environments such as wetlands, landfills, and agriculture has very little 13C (Bakkaloglu et al. 2022), so the signature of microbial methane is “lighter” than methane produced by fossil fuels, such as natural gas. Livestock methane is created as a by-product of digestion in the stomachs of ruminants, such as cattle, sheep, and goats. The isotopic composition of livestock methane is also dependent on the diet of the animals, but it is generally similar to that of biogas methane, with a lower ratio of 13C to 12C compared to fossil fuel methane.

By analysing the methane isotopic composition, scientists can determine the relative contribution of different sources to the overall methane levels in the atmosphere and track how methane is distributed and transformed over time, whether it is formed biogenically (agricultural, waste or wetlands), thermionically (natural gas, oil or coal mining) or pyrogenically (incomplete combustions, such as wildfires).

Scientific isotopic methane data provides an essential fingerprint without which we’d be unable to carry out our work on understanding emissions.  If we can understand the source of methane, we can develop better mitigation strategies to tackle it.

Fig 2. Globally averaged atmospheric CH4 (top) and the trend in the ratio of the isotope carbon-13(bottom) from samples collected by NOAA’s Global Greenhouse Gas Reference Network. The blue curves are derived from weekly data and the black curves are annual means. The data from 2020 are preliminary. Credit: Xin Lan, NOAA Global Monitoring Laboratory(Lan et al. 2021; NOAA,2021) 2021

But there’s still some controversy.  Fig 2 shows the trend in atmospheric methane concentration (top) and  Carbon-13 ratio.  It is clear that whilst overall methane levels in the atmosphere are rising +100ppb in 20 years, (NOAA, 2023) the ratio of C-13 is falling. Schaefer et al. 2016 suggested that the methane isotopic signature is shifting from fossil fuels to biogenic sources in the 21st century. So the question is – is this because we have reduced fossil fuel-related methane emissions (Schwietzke et al. 2016), or has there been a greater  increase in biogenic methane emissions or the changes in sink mechanism or both? According to the IEA (2022), methane emissions from fossil fuels increased by close to 5% in 2021, and Menoud et al (2022) found that fossil fuel-related sources could have more depleted values than previous estimates used in global models. But there is still large uncertainty coming from natural sources. We should take into account both each source methane emission and their isotopic signature to better understand the global methane budget.

We’ll look at that in Part 2.

A Pathway to Sustainability


It’s Sustainability Week at Imperial. So what better time to spotlight the brilliant work of the Sustainable Gas Institute’s Dr Jasmin Cooper.

On top of her day job – making a significant contribution to the scientific community’s understanding of greenhouse gas (GHG) emissions – Jasmin is also a member of the Department of Chemical Engineering’s (DoCE) sustainability committee. We caught up with Jasmin to find out more about what her role on the committee entails and how she her scientific skillset is playing a pivotal role in progressing Imperial’s sustainability ambitions.


There’s little disputing the scientific evidence that climate change is one of the greatest challenges facing human civilisation this century.  We’re already seeing consequences globally. 2022’s floods in Pakistan and the big Christmas freeze in North America are just two of a growing list of recent events. Weather attribution (being able to prove the link between climate change and extreme weather such as heatwaves, droughts, floods and super-storms) is a growing field in itself that Imperial scientists are involved in.  But when it comes to tackling the root causes, there’s an area of expertise that’s in at the beginning – Life Cycle Assessment (LCA).

The biggest challenge in changing human behaviour is that the causes of climate change – anthropologically generated greenhouse gases (GHGs) – are, a seemingly invisible threat. To cut GHG emissions, we need to better understand how much is produced and where they come from. Our sustainability committee is focused on doing that for DoCE operations.

Imperial’s Department of Chemical Engineering set up its sustainability committee in 2021. It’s part of a college-wide strategy to improve environmental sustainability across all of Imperial’s estate, both through efficiency and innovation – with the holy grail of achieving carbon neutrality by 2040.

A robust scientific technique for quantifying these emissions is Life Cycle Assessment (LCA).  As we work, rest and play there’s a life cycle for everything we interact with.  From the emissions impact of growing and processing the food we eat to the footprint of manufacture, usage and scrapping of the vehicles we drive – even the bikes we cycle and the streaming content we binge – everything has a carbon footprint.

Obtaining baseline data to quantify carbon emissions requires significant interdepartmental cooperation – with departmental operations, Imperial’s estates, ICT and campus services teams – and of course our student and academic population. So it’s as much an exercise in collaboration as it is scientific analysis

Once the carbon footprinting is done, across all of DoCE’s activities and building assets we move forward to the LCA.  We’re then able to make assessments on where we can make changes to each pathway to reduce our emissions impact – hopefully to Net Zero by 2040.

In the meantime, if you want to help right away – here are some energy-saving tips from the sustainability committee.


How big a setback is the Nord Stream gas leak for climate change goals?

The news that the Nord Stream gas pipelines have stopped leaking is a relief to all of us involved in curbing emissions from methane, but the consequences of such a massive gas leak are still of huge concern. In her latest blog, the Sustainable Gas Institute’s Dr Jasmin Cooper examines how big an effect the alleged sabotage of the pipelines might have on climate change goals.

The Nord Stream 1 and 2 pipelines are two large subsea pipelines which connect Russia to Germany. The pipelines are the primary source of Russian gas exports to Germany.  Until the Russian invasion of the Ukraine in February they transported up to 55 billion cubic meters of gas per year, accounting for most of Germany’s gas imports. On September 26th 2022 two small tremors were detected by the Geological Survey of Denmark. Whilst there was no active flow through the pipelines by this point, they were still full of gas. The tremors are believed to have been caused by deliberate explosions – alleged sabotage that has resulted in four major methane leaks.

The leaks have caused concerns around the security of energy infrastructure as well as the security of energy supplies globally. After the announcement of the first leak in the Nord Stream 2 pipeline, gas prices across Europe jumped – having been falling since a previous peak in August. The leaks also raised energy security concerns in Europe as the continent heads into winter. However, Germany secured two floating liquefied natural gas (LNG) terminals in August of this year and in mid-September was in talks with Qatar and the United Arab Emirates to secure LNG deliveries. In August of this year, the mainland EU member states agreed to a plan to cut gas use by 15%3, so the damage caused to the Nord Stream pipelines may not impact gas supply so much as the rise in gas prices.

While there is still a lot of uncertainty around the leak; including the cause, the extent of the damage to the pipeline and how much natural gas has leaked out – this incident has the potential to be one of the biggest climate disasters so far in the 21st century. Subsea pipeline leaks are unusual so there are no past examples to directly compare to.

Deep Water Horizon was a drilling rig in the Gulf of Mexico which exploded in April 2010 resulting in huge damage to the marine environment from oil. The Nord Stream leaks are natural gas, so the environmental impacts will be to climate change and global warming rather than a direct impact on the marine environment and wildlife. Our only comparable large gas leaks are the Aliso Canyon gas leak, which is estimated to have emitted 97,100 tonnes4 of methane between October 23rd 2015 and February 18th 2016 and the Raspadskya coal mine leak, which was found to be emitting nearly 90 tonnes of methane per hour5 earlier this year  – and could emit 764,000 tonnes of methane by the end of 2022. .

The Nord Stream pipelines while not actively transporting gas, did contain 778 million cubic meters of natural gas. This would be 360,000 to 460,000 tonnes of methane, which in CO2 equivalence is 11 million to 14 million tonnes of CO2eqb. In the context of total global methane emissions, between 2008 to 2017 total global emissions were 576 Tg CH4 per year (1 Tg = 1,000,000 tonnes), with 80 Tg CH4 per year from the oil and gas sector. So, the amount of gas stored is equal to less than 0.1% of total global methane emissions, or 0.5-0.6% of annual oil and gas methane emissions. While this may seem like a small percentage, they are similar to the methane emissions of Denmark, Ghana or Yemen in 2021. That volume of gas has an economic value – based on prices on 05 October 2022 – of €1.4 billion and is approximately 5 days’ worth of supply to Germany based on Nord Stream transport when it was operational.  So from a climate, social and economic perspective, this is a catastrophic loss.

How much of the methane stored in the two pipelines will be emitted is yet to be determined. From the amount of gas stored and the images of the leak, it is evident the leak will be a big blow to ambitions to meet climate change targets. The Global Methane Pledge – launched in November 2021 – has seen over 120 countries pledge to cut their methane emissions by 30% (relative to 2020 levels) by 2030. Since then, many have launched new regulations on how their methane emissions can be slashed. The Nord Stream leaks will likely negate much of the progress made so far.

assuming natural gas is 70 to 90% methane and methane density of 0.7 kg per cubic meter
assuming GWP100 of 30 TFF
assuming gas price €174.76 per MWh; 36 PJ per 1 bcm of natural gas

How successful is the UK’s Net Zero strategy in the biowaste sector?

Greenhouse gas (GHG) emissions from the waste sector are primarily composed of methane (CH4) released from landfills. Biodegradable wastes such as food, garden waste, manure, paper and cardboard emit methane during anaerobic decomposition in landfills. In our latest blog, SGI emissions scientist Dr Semra Bakkaloglu explains some of the key findings from her newly published paper into emissions of CH4 from biowaste.

We know that CH4 is around 28 times more potent as a greenhouse gas than carbon dioxide (CO2) over a 100-year period (IPCC 2021). So, reducing CH4 emissions – from all sources – is critical to keeping global median temperature rise well below 2 degrees Celsius. In the UK, the waste sector is the second largest CH4 emitter after agriculture, so waste sector emissions deserve significant attention if we are to achieve the UK’s net zero targets.

The UK biodegradable waste strategy aims to divert progressively more waste from landfills into anaerobic digestion or composting facilities for recycling. Recent studies (Gua et al. 2020, Bakkaloglu et al. 2022a, Cusworth et al. 2020) indicate that anaerobic digesters and composting facilities can be a significant source of CH4 emissions, and our latest study aims to evaluate the UK’s biowaste strategy to better understand future CH4 emissions.

We use the term biowaste in this study to cover food and garden waste, because the broader term – biodegradable – encompasses a wider variety of wastes such as manure, sewage sludge, paper, cardboard and more. The objectives for our research were to compare the environmental impacts of biowaste treatment in the UK and to assess the effect of CH4 emissions. We considered four different waste treatment methods anaerobic digestion, composting, incineration, and landfill), as well as seven different scenarios for waste in various ratios treated using current and future waste management technologies. Full details of those scenarios are explained in full paper.

The four biowaste treatment methods assessed: anaerobic digestion; in-vessel composting; landfill; incineration with energy recovery. The dashed line indicates the system boundary and blue text indicates recovered resources.

In our latest study, we combined mobile CH4 emissions data for anaerobic digesters (AD) – rather than relying on the default emission factors for life cycle assessment (LCA). Approximately 19% of biowaste in the UK is currently landfilled, while 38% is incinerated. Of the remaining 53%, the waste strategy set a target for AD of 15% in 2020.  It is reasonable to assume that 15% of biowaste is sent to AD and the remaining 28% is sent to the composting facility. Combining the mobile methane emissions from AD and composting facilities, we can estimate that current annual UK average methane emissions are approximately 58.2 kilotonnes.

If we sent 90% of biowaste to AD and 1% to landfills as a strategy for the reducing landfilled biowaste by 2050, annual emissions would decrease to 30.3 kilotonnes. Therefore, sending more biowaste to AD can reduce emissions, but if we want to achieve net zero emissions from the waste sector, remaining emissions must be offset. Therefore, we recommend that future UK waste management policies should also focus on eliminating fugitive emissions from treatment technologies, especially AD, in order to achieve net zero emissions by 2050.

Why shale gas is not the right answer for the UK’s short-term energy needs

"Hydraulic Fracking" by phxlaw1 is licensed under CC BY-NC-ND 2.0.
Hydraulic fracturing in Colorado

On September 22nd the UK Government announced the official lifting of the moratorium on fracking for shale gas. This was a ban put in place in 2019 after much opposition from community groups and environmentalists, as well as a report by the Oil and Gas Authority.

The Sustainable Gas Institute’s Dr Jasmin Cooper began her research career investigating shale gas and shares her expert perspective on why this policy U-turn could be a red-herring for the UKs energy strategy.

Shale gas is natural gas that is produced from shale formations. It has the same composition and chemical properties as the natural gas we’re all familiar with, but the key difference is in the rock the gas is extracted from. In conventional gas reserves, like those in the North Sea and Qatar, natural gas is extracted from a porous rock such as sandstone. Being porous, there are channels the gas can travel through which makes extraction relatively straightforward. Shale is not porous, so the natural gas is held in pockets which are not connected. Therefore, to make the gas extractable, fractures must be artificially created to connect the pockets and provide a pathway for extraction. The process, called hydraulic fracturing, has become more commonly known as ‘fracking’.

Hydraulic fracturing is when a mixture of water, sand and chemicals (including antibacterial agents and chemicals which make the solution more viscous) is injected into rock under high pressure.  Large quantities of the solution are needed along with energy to inject it at the pressures required.

The 2019 Conservative Party manifesto pledged the moratorium would not be lifted unless hydraulic fracturing could be proven to be safe scientifically – in regard to earthquakes caused by hydraulic fracturing. But since then, there has been little scientific evidence to prove it is. The British Geological Survey (BGS) published a report on September 22nd 2022 which found that more work is needed to understand the risk of earthquakes, as well as how to manage those risks.

Hydraulic fracturing has been carried out on a large scale in the USA, where it led to a significant increase in natural gas production and is credited with transforming their gas market.

Understandably, the transformation in energy security and the jobs a shale gas industry could create are put forward as the main arguments for developing it in the UK. The energy crisis in Europe as a result of the Russia-Ukraine conflict  – with gas prices climbing to a record high as mainland Europe shifts away from its dependence on Russian gas – is another driver of the Government’s decision to lift the ban- with the intention of boosting domestic production and lessening the rise in energy costs.

But the UK is quite different to the USA, in the geology, extent of our reserves and onshore infrastructure to manage any gas extracted. As of September 2022 there are no commercially operating shale gas wells in the UK, and just two exploration wells, both owned and operated by Cuadrilla.

It takes time to determine whether a shale gas well will produce marketable quantities of gas, and many tests are needed.  Surveying the geology of the site, studying core samples for the presence of gas, as well as hydraulic fracturing tests so see how much gas can be liberated – these all take time.

Given the minimal shale gas activity in the UK since 2010  – when the first UK shale gas exploration well was drilled – it is highly unlikely the industry could grow in size and scale at the rate required to have the desired impact on energy supply and security.  It’s also questionable whether shale gas could have an impact on energy prices. The UK’s oil and gas industry is largely in the North Sea. Unlike the USA there is little onshore supply chain infrastructure. Significant investment into new infrastructure to process shale gas to pump it into the UK’s gas grid will be needed. These, in addition to the costs of drilling and hydraulic fracturing could make shale gas far less cost competitive than the Government are suggesting.

Overall, it is unlikely the lifting of the moratorium will have an impact the UK’s energy security and prices. The small scale and limited activity of the industry mean there is a long way to go before the industry could reach commercial scale productivity. The strong social and environmental opposition would likely also slow down any progress in developing a shale gas industry. All in all, shale gas is not going to be an answer to the UK’s energy crisis and other avenues would be better to explore.

Biogas and biomethane emissions – a quick win for decarbonising future energy systems?

In our latest blog, Dr Semra Bakkaloglu reflects on our newly published research into biogas and biomethane emissions.

Over 100 years, methane has 27.2 times the global warming potential of carbon dioxide. So when it comes to climate change, it’s pretty potent stuff. Methane concentrations in the atmosphere are increasing, which makes it a quick-win target in the drive to decarbonise our global energy system.

It’s no coincidence that over 100 countries signed the Global Methane Pledge at COP26 in Glasgow. The pledge is a commitment to reduce methane emissions by 30% (from 2020 levels) by 2030. But a 30% reduction is ambitious, not to mention a complete reversal of the current trajectory of increasing methane emissions. Achieving that will require a combination of measures, which include reducing emissions from the existing supply chain whilst also reducing reliance on natural gas as a fuel by switching to cleaner energy alternatives, such as electrification or hydrogen.

But those new energy alternatives are at wildly different stages of technological readiness and require major infrastructure changes and investment. They are unlikely to happen overnight – and many are unlikely to become mainstream within the next 8 years.

One sector that is expected to grow and contribute to decarbonisation in that transition period is biogas and biomethane – a mixture of gases (mostly methane (CH4 and carbon dioxide (CO2)) produced from biodegradable materials. It’s a technology with a lot of factors in its favour: the volume of organic waste – known as feedstock – generated by modern societies is increasing, it provides a beneficial alternative disposal method for that waste, and conversion of energy from waste to biogas can begin to replace fossil fuel gas – which in turn reduces overall greenhouse gas (GHG) emissions. Ultimately it contributes to meeting those government commitments.

But biogas and biomethane production can also emit methane and it’s an area that’s been lacking in research. No study has assessed methane emissions from the biogas and biomethane supply chain – until now.

For our recent study, we synthesised methane emissions from the biogas and biomethane supply chains by breaking down stages and identifying key elements from direct measurements studies. We used a statistical model Monte Carlo approach to estimate aggregate methane emissions with uncertainty assessment, which can account for up to 343 g CO2-eq. We observed that biogas and biomethane supply chains exhibit similar emission characteristics to oil and natural gas with super-emitters present at all stages. In our study, 62% of the emissions come from just 5% of the point sources – these super-emitters waste a disproportionately large amount of methane

“..62% of the emissions come from just 5% of the point sources – these super-emitters waste a disproportionately large amount of methane.”

The International Energy Agency’s (IEA) inventory, (the only other benchmark data currently available) estimated total methane emissions from bioenergy to be 9.1 Tg in 2021.

Our study, which only looked at one aspect of bioenergy (biomethane), discovered that methane emissions are more likely to be in the range of 6.4 – 7.8 Tg per year (95th percentile), but the average methane emissions are around 2.8 Tg according to the IEA’s global biogas and biomethane generation rate 1.47 EJ in 2018. If biogas and biomethane production are expanded to the same scale as the oil and natural gas industries and no action is taken, they could emit almost 4 times as much methane as oil and gas supply chains (82.5 Tg in 2021). At present, our results indicate they are high – higher even than natural gas, which is clearly a worry.

Considering the latest IPCC-AR6-WG3 climate change mitigation scenarios that achieve the Paris Agreement 1.5°C temperature rise mitigation target with low or no overshoot, we can see that biogas and methane could have up to 28 EJ of production by 2050. Using our mean emissions rate (52.3 g CO2-eq per MJHHV) from this study, this would result in 53.8 Tg methane emissions. This drives home the point that it is extremely important to reduce biogas and biomethane emissions for these energy sources to play a constructive role in our future energy system.

Finding and removing these large emitters is a critical step toward significantly reducing overall emissions from biomethane and natural gas supply chains. It’s not just about controlling greenhouse gases either. There’s a significant economic argument for addressing emissions – all that lost gas has a commercial value.

According to the European Biogas Association (EBA), biomethane can be produced for as little as €55 per MWh, while natural gas costs around €80 per MWh. When our findings are combined with the cost of biomethane, we can calculate that emitting 2.8 Tg of methane per year in average (based on the IEA’s global biomethane and biogas generation rate for 2018) can result in an average a global economic loss of 2.4 billion euros in average.

“… emitting 2.8 Tg of methane per year can result in a global economic loss of €2.4billion in average.”

Through improved design, detection, measurement, and repair techniques, much of the observed emissions can be avoided. If we focus on super-emitters, there are some potential quick wins too. We found that the digestate stage and upgrading units need the most attention in this regard. There’s a lot of overlap with oil and natural gas supply chains too – preventing gas venting, reducing flaring activities and designing a closed unit with a vapour recovery system can all contribute to reducing emissions.

Additionally, we need better regulations, continuous emission measurements, and close collaboration with biogas plant operators in order to address methane emissions and meet the Paris Agreement temperature target.

We know what we need to do to tackle those emissions; the important thing is to get started right away. Biomethane is an important renewable energy source, but it could be even better! Combating biomethane emissions is not only significant for meeting Paris Agreement’s target but also boosting the global economy.

Hydrogen and other short lived climate pollutants – is the time horizon important?


Dr Jasmin Cooper, Research Associate here at Imperial’s Sustainable Gas Institute, shares the work being done to model the potential global warming impacts of H2 emissions in possible future supply chains.


Short lived climate pollutants are greenhouse gases which stay in the atmosphere for much less time than carbon dioxide (CO2). Despite this, they are much more powerful than CO2 and can trap as much heat as thousands of kilograms of CO2 on a mass-to-mass basis (Table 1).

Table 1: Properties of different greenhouse gases (Derwent, 2018, Derwent et al., 2001, Derwent et al., 2018, Derwent et al., 2020, Field and Derwent, 2021, Forster et al., 2021, Myhre et al., 2013, IPCC, 2007).
Greenhouse gas GWP over 500-year time horizon GWP over 100-year time horizon GWP over 20-year time horizon Lifetime in the atmosphere
Carbon dioxide 1 1 1 Hundreds of years
Methane 7.6 29.8±11 82.5±25.8 12 years
Black carbon 900±800 3,200 (+300/-2,930) A few weeks
Hydrofluorocarbonsa 435 1,526±577 4,144±1,160 15 years
Hydrogen 4.3 to 10 Four to seven years
afor the hydrofluorocarbon HFC-134a.

In recent years methane (CH4) has emerged as the most important short lived climate pollutant with the IPCC’s AR6 report finding that emissions of it must be cut for 1.5°C or 2°C temperature targets to be met (IPCC, 2021, McGrath, 2021). This is because it is, at present, the second most important greenhouse gas, being responsible for around 30% of global warming to date (McPhie, 2021). It is also the second most emitted greenhouse gas e.g. in 2019 the UK’s total greenhouse gas emissions were 80% CO2, 12% CH4, 5% nitrous oxide and 3% fluorinated gases (BEIS, 2021). As energy systems move away from fossil fuels, hydrogen (H2) could replace natural gas in areas that are difficult to decarbonise through electrification, such as heavy industry and heat.

H2 is a greenhouse gas, but unlike CH4 it is an indirect greenhouse gas. It does not absorb and trap heat but interferes with other (direct) greenhouse gases by enhancing their warming potential (Derwent, 2018). Therefore, in a world where H2 is used in a way akin to natural gas is now, there is the potential for H2 to be emitted into the atmosphere and contribute towards global warming. While there is limited literature available which estimates the impacts of it in the atmosphere, some as-yet to be peer reviewed research suggests short-term forcing from H2 could be higher than that of methane.

Here at the SGI, we have been modelling the potential global warming impacts of H2 emissions in possible future supply chains. When a 100-year time horizon is considered, H2 will likely not impose extra burdens to meeting Paris Agreement goals. However, if shorter time horizons and other climate metrics are considered, the impacts of H2 could be greater, as short-lived climate pollutants exhibit the majority of their warming impacts in the first few years of being emitted. This is an area where more research is needed, as it is important to fully understand the climate impacts of H2 if it is to become a key energy source.

Figure 1: Temperature response curve of various greenhouse gases (Myhre et al., 2013).

Whilst short lived climate pollutants are important, CO2 is still the most important greenhouse gas because its atmospheric lifetime is long (hundreds of years), and its warming effect is stable (Figure 1). Therefore, when comparing greenhouse gases and creating strategies to tackle global warming, it is important that attention not be drawn away from CO2 i.e. making large cuts to methane emission cannot be used as an excuse to slow down rates of decarbonisation. While short lived climate pollutants are important in the fight against climate change, caution should be used when pitting greenhouse gases against one another based on their GWP, especially GWP over 100-year horizons.

This could lead to unintended consequences either side. For example, a shift away from the importance of CO2 resulting in decarbonisation rates slowing down, or non-CO2 greenhouse gases not being given enough attention and consequentially little action being taken to mitigate emissions.

Overall, the time-horizon considered when comparing greenhouse gases to other another is important but what is more important is the quantity of greenhouse gases emitted. GWP is a useful metric to promote the importance of emissions abatement of non-CO2 greenhouse gases, but its importance becomes less pronounced when emissions are vastly reduced.


References 

BEIS. 2021. 2019 UK Greenhouse Gas Emissions, Final Figures London, UK; Department for Business, Energy and Industrial Strategy (BEIS). Available:’ https://assets.publishing.service.gov.uk/government/uploads/system/uploads/attachment_data/file/957887/2019_Final_greenhouse_gas_emissions_statistical_release.pdf

Derwent, R. 2018. Hydrogen for heating: atmospheric impacts – a literature review London, UK; Department for Business, Energy and Industrial Strategy (BEIS). Available:’ https://www.gov.uk/government/publications/atmospheric-impacts-of-hydrogen-literature-review

Derwent, R. G., Collins, W. J., Johnson, C. E. & Stevenson, D. S. 2001. Transient Behaviour of Tropospheric Ozone Precursors in a Global 3-D CTM and Their Indirect Greenhouse Effects. Climatic Change, 49, 463-487. 10.1023/A:1010648913655

Derwent, R. G., Parrish, D. D., Galbally, I. E., Stevenson, D. S., Doherty, R. M., Naik, V. & Young, P. J. 2018. Uncertainties in models of tropospheric ozone based on Monte Carlo analysis: Tropospheric ozone burdens, atmospheric lifetimes and surface distributions. Atmospheric Environment, 180, 93-102.

Derwent, R. G., Stevenson, D. S., Utembe, S. R., Jenkin, M. E., Khan, A. H. & Shallcross, D. E. 2020. Global modelling studies of hydrogen and its isotopomers using STOCHEM-CRI: Likely radiative forcing consequences of a future hydrogen economy. International Journal of Hydrogen Energy, 45, 9211-9221. https://doi.org/10.1016/j.ijhydene.2020.01.125

Field, R. & Derwent, R. 2021. Global warming consequences of replacing natural gas with hydrogen in the domestic energy sectors of future low-carbon economies in the United Kingdom and the United States of America. International Journal of Hydrogen Energy.

Forster, P., Storelvmo, T., Armour, K., Collins, W., Dufresne, J. L., Frame, D., Lunt, D. J., Mauritsen, T., Palmer, M. D., Watanabe, M., Wild, M. & Zhang, H. 2021. The Earth’s Energy Budget, Climate Feedbacks, and Climate Sensitivity. In: Climate Change 2021: The Physical Science Basis. Contribution of Working Group I to the Sixth Assessment Report of the Intergovernmental Panel on Climate Change Cambridge, UK and New York, USA; Cambridge University Press. Available:’ https://www.ipcc.ch/report/ar6/wg1/downloads/report/IPCC_AR6_WGI_Full_Report.pdf

IPCC. 2007. Climate Change 2007: The Physical Science Basis. Contribution of Working Group I to the Fourth Assessment Report of the Intergovernmental Panel on Climate Change, Cambridge, UK and New York, USA; Cambridge University Press. Available:’ https://www.ipcc.ch/site/assets/uploads/2018/05/ar4_wg1_full_report-1.pdf

IPCC. 2021. AR6 Climate Change 2021: The Physical Science Basis, Geneva, CH; Intergovernmental Panel on Climate Change (IPCC). Available:’ https://www.ipcc.ch/report/ar6/wg1/

McGrath, M. 2021. Climate change: Five things we have learned from the IPCC report. BBC News.

McPhie, T. 2021. International Methane Emissions Observatory launched to boost action on powerful climate-warming gas [Press Release]. Brussels, BE. Available: https://ec.europa.eu/commission/presscorner/detail/en/IP_21_5636.

Myhre, G., Shindell, D., Bréon, F. M., Collins, W., Fuglestvedt, J., Huang, J., Koch, D., Lamarque, J. F., Lee, D., Mendoza, B., Nakajima, T., Robock, A., Stephens, G., Takemura, T. & Zhang, H. 2013. Anthropogenic and Natural Radiative Forc- ing. In: Climate Change 2013: The Physical Science Basis. Contribution of Working Group I to the Fifth Assessment Report of the Intergovernmental Panel on Climate Change, Cambridge, UK and New York, USA; Cambridge University Press. Available:’ https://www.ipcc.ch/site/assets/uploads/2018/02/WG1AR5_Chapter08_FINAL.pdf