Tag: methane

Methane origins part III – the Relentless Rise of Methane

In Methane origins part two we pondered the methane plateau of the early noughties.  For part three the Sustinable gas Institute’s Dr Semra Bakkaloglu looks at what has happened since, and where the science points in figuring out the relentless rise in the concentration of methane in Earth’s atmosphere.


Methane concentrations are a two-way street. We know that the rise in the mole fraction (the measure of concentration in the atmosphere) for the gas can be attributed to two things; changes in the relative amounts and totals of emissions from biogenic, thermogenic, and pyrogenic sources, or its destruction through natural methane sinks – Nisbet et al., 2019.

So, which is it – is more being produced? Or is less being destroyed? It is an important question, because – as Nisbet et al also pointed out – the accelerating increase in concentration is enough to push us past Paris Agreement target limits.

Unfortunately, that’s not easy to answer – the Methane cycle (fig 1) is a complex thing.
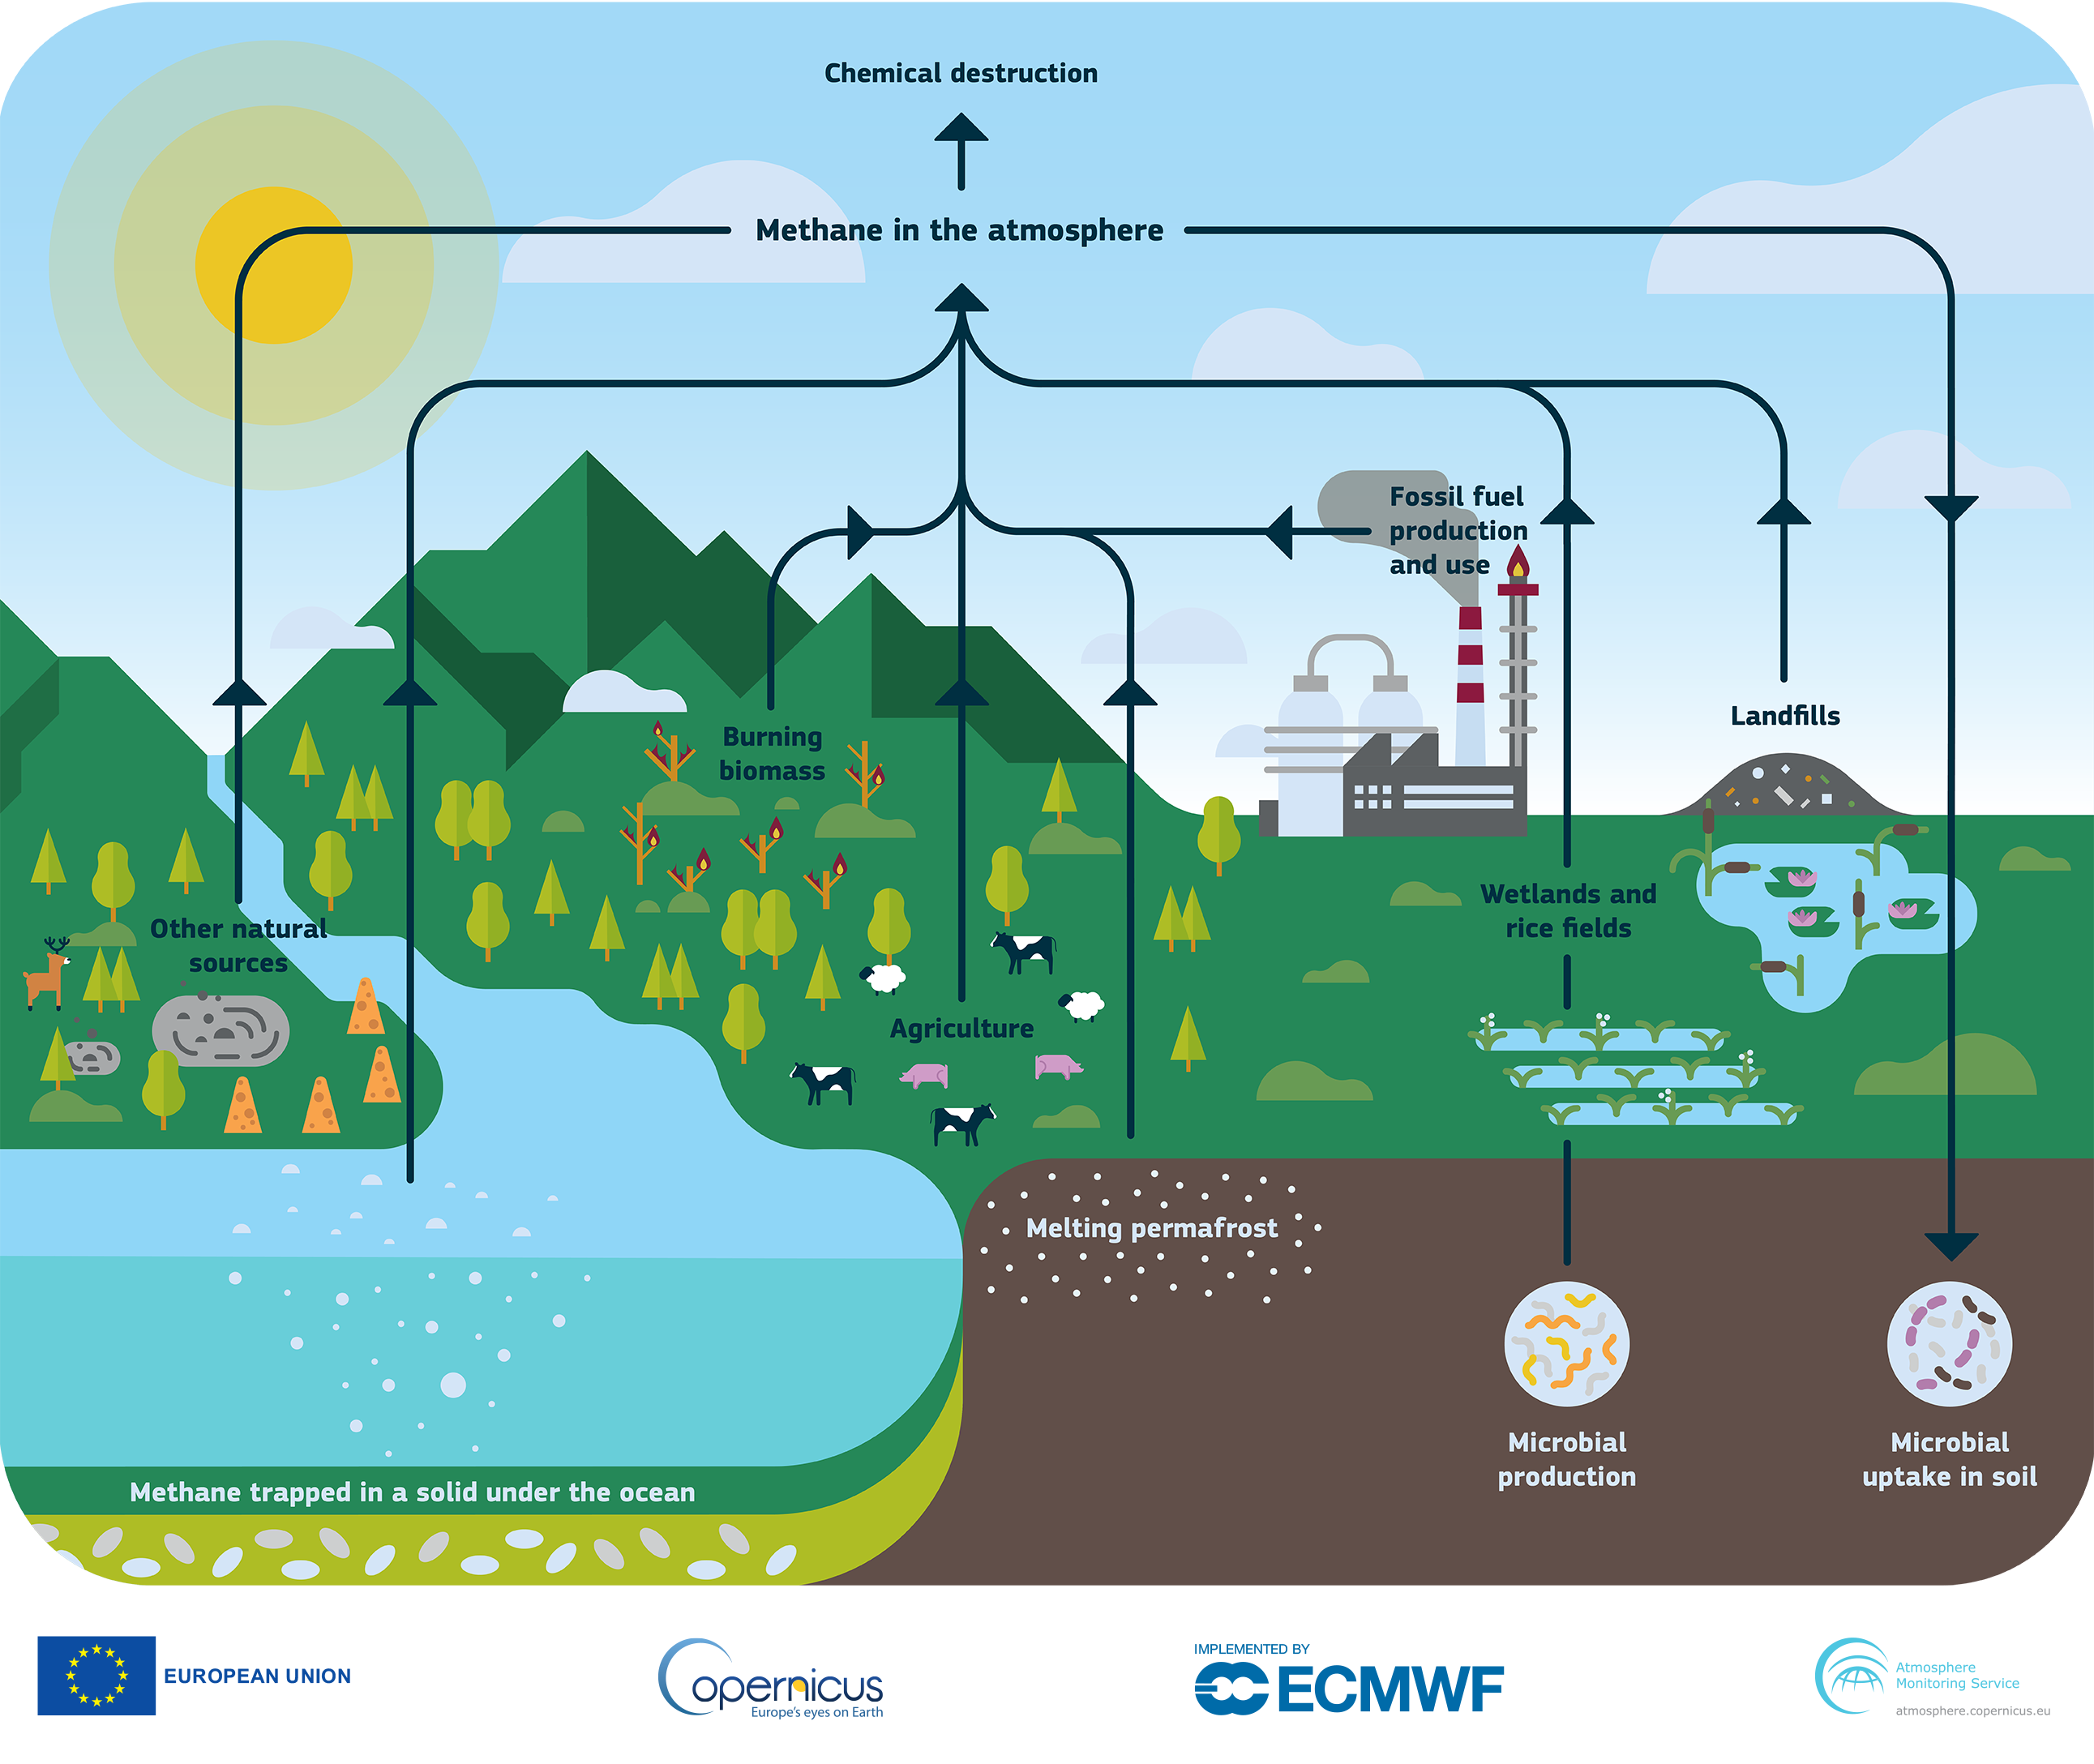
Fig 1: The methane cycle. Credit: Copernicus Atmosphere Monitoring Service, ECMWF.


So – remember part I? If you don’t, here’s a quick refresher on isotopic δ 13C – CH4 source signatures.  To better understand the methane origins –  the δ 13C – CH4 are defined as:

δ values are reported in per mille (‰), relative to the international standard materials Vienna Peedee Belemnite (VPDB) for δ13C.

So let’s investigate the research to see what scientists say about the increase in atmospheric methane concentration after 2006.

A 2022 study by Drinkwater et al examined satellite remote sensing data which suggested both – evidence of lighter atmospheric methane isotopic signature changes (which tend to indicate increasing natural emissions), coupled with a decrease in destructive rate via Hydroxyl radical (OH) sink mechanisms.

But in 2021 Zhang et al argue that anthropogenic emissions are responsible for atmospheric methane increases as current process-based wetland CH4 models cannot explain the fact that a significant rise in emissions from natural wetlands caused a decrease in atmospheric δ 13C – CH4 values.

If we are considering increasing anthropogenic emissions from biogenic sources, it is important to focus on livestock emissions since they are the largest source in the global methane budget. Research by Chang et al in 2019 suggests that ruminants’ enteric emissions played a larger role in the observed decline of δ13C in atmospheric methane from 2000 to 2012.

In my own paper, we examined waste source signatures and reported that the isotopic signature of CH4 – sourced from biogas plants and active landfills – exhibits more significant reductions in the 13C isotope compared to CH4 obtained from other waste sources.

We also know that governments are adopting the practice of diverting biowaste away from landfills towards anaerobic digestions, which is a beneficial strategy for mitigating methane emissions. These might explain the rise in CH4 mole fractions with a lighter isotopic signature.

So, what about the contribution of oil and gas emissions to increasing atmospheric methane levels? The methane isotopic signature being lighter suggests a decrease in oil and gas emissions. But recent International Energy Agency (IEA) data contradicts that. Methane emissions from the oil and gas sector have been increasing – so either the industry is getting very good at tackling supply-chain emissions, or we need to question whether we are missing something and investigate how the isotopic signature of methane from the oil and gas sector has been evolving.

A study in 2022 by Menoud et al supports that theory, reporting that the fossil fuel source signature could have been more depleted (more negative, lighter) in recent years.

Overall, it is evident that a great number of factors are responsible for the increase in atmospheric CH4 with a lighter isotopic signature. It is crucial to note that the atmospheric chemistry of methane is highly complex, and the main source of uncertainty when using δ13C data to distinguish between different methane sources, especially in methane sink mechanisms, as observed by Basu et al in 2022.

It is not going to be a clear-cut answer, but a plausible explanation includes the rise in emissions from agriculture and waste as well as fossil fuels with possible contributions from wetlands and a weakening sink. But we need significantly more observations to completely understand the global CH4 budget and key atmospheric processes in order to reduce the uncertainties associated with δ13C data in methane source differentiation.

Methane – an origin story

Emissions from fossil fuels or biological sources, a decrease in the atmosphere’s ability to break down methane or something else? The emissions work of the SGI relies on data that uses advanced chemical science to enable the identification of methane from different sources. In part one of a two-part blog, Dr Semra Bakkaloglu from our emissions team, explains the atomic-level forensics that scientists use to determine where methane came from.


The SGI’s work on methane emissions is important for understanding how governments and industries involved in energy supply chains can reduce emissions of this very significant greenhouse gas (GHG).  

Our research focuses on methane emitted from natural gas, biogas and hydrogen supply chains. These are anthropogenic sources of methane; neither would be a significant problem without the human ingenuity that created their supply chains. To do our research, we need to be sure the sampling and monitoring data we use has distinguished correctly between naturally occurring methane such as that from wetlands – and anthropogenically induced emissions such as from livestock farming and energy supply chains.

But surely methane is just methane, right? CH4 – an odourless, invisible, flammable gas made up of one carbon atom, bonded to four hydrogen atoms. Where do you start to tell the difference between methane that has bubbled up from the swampy depths of decomposing wetland and fossil methane that has propelled itself to freedom through a leaky flange in a 50-year-old natural gas pipeline?

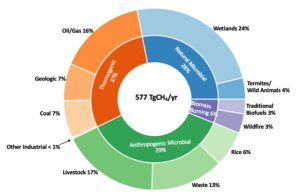
Fig 1 A plausible CH4 emissions budget ca. 2015 based on Lan et al., 2021 that is in agreement with both observed atmospheric CH4 and 13CH4 (given in Fig 2). Atmospheric methane grew by 10 ppb in 2015 implying a global atmospheric chemical sink of 548 TgCH that year (Lan et al., 2021; NOAA, 2021 Picture taken from NOAA, 2022)

To calculate that – and arrive at a chart such as fig. 1 – the answer lies in the number of neutrons. Methane isotopes are variations of the methane molecule that have a different number of neutrons in their atomic nuclei. Tracing the sources and dynamics of methane in the environment involves using the specific characteristics of these isotopes to identify where the methane came from and how it is behaving. This is done by analysing the ratios of different isotopes in a sample and comparing them to known ratios from each specific source.

The most common methane stable isotope is carbon-12 (C12), which has 6 protons and 6 neutrons, and carbon-13, the heavier isotope; as well as hydrogen isotopes such as H-1 or H2 (deterium, denoted as D). Each CH4 source exhibits different partitioning of light (12C or H) and heavy (13C or D) isotopes of carbon and hydrogen, so 13C/12C or D/H. This provides the “DNA” for us to determine the source.

By carefully calculating the ratio of the most prevalent form of carbon, carbon-12, and its stable isotope, carbon-13 (13C), which has an extra neutron, we can determine the origin of the carbon in a methane sample.

13C is a tiny bit heavier than 12C.  Methane produced by microorganisms in environments such as wetlands, landfills, and agriculture has very little 13C (Bakkaloglu et al. 2022), so the signature of microbial methane is “lighter” than methane produced by fossil fuels, such as natural gas. Livestock methane is created as a by-product of digestion in the stomachs of ruminants, such as cattle, sheep, and goats. The isotopic composition of livestock methane is also dependent on the diet of the animals, but it is generally similar to that of biogas methane, with a lower ratio of 13C to 12C compared to fossil fuel methane.

By analysing the methane isotopic composition, scientists can determine the relative contribution of different sources to the overall methane levels in the atmosphere and track how methane is distributed and transformed over time, whether it is formed biogenically (agricultural, waste or wetlands), thermionically (natural gas, oil or coal mining) or pyrogenically (incomplete combustions, such as wildfires).

Scientific isotopic methane data provides an essential fingerprint without which we’d be unable to carry out our work on understanding emissions.  If we can understand the source of methane, we can develop better mitigation strategies to tackle it.

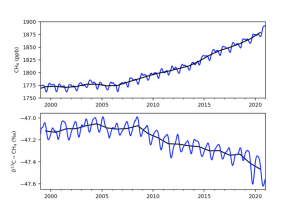
Fig 2. Globally averaged atmospheric CH4 (top) and the trend in the ratio of the isotope carbon-13(bottom) from samples collected by NOAA’s Global Greenhouse Gas Reference Network. The blue curves are derived from weekly data and the black curves are annual means. The data from 2020 are preliminary. Credit: Xin Lan, NOAA Global Monitoring Laboratory(Lan et al. 2021; NOAA,2021) 2021

But there’s still some controversy.  Fig 2 shows the trend in atmospheric methane concentration (top) and  Carbon-13 ratio.  It is clear that whilst overall methane levels in the atmosphere are rising +100ppb in 20 years, (NOAA, 2023) the ratio of C-13 is falling. Schaefer et al. 2016 suggested that the methane isotopic signature is shifting from fossil fuels to biogenic sources in the 21st century. So the question is – is this because we have reduced fossil fuel-related methane emissions (Schwietzke et al. 2016), or has there been a greater  increase in biogenic methane emissions or the changes in sink mechanism or both? According to the IEA (2022), methane emissions from fossil fuels increased by close to 5% in 2021, and Menoud et al (2022) found that fossil fuel-related sources could have more depleted values than previous estimates used in global models. But there is still large uncertainty coming from natural sources. We should take into account both each source methane emission and their isotopic signature to better understand the global methane budget.

We’ll look at that in Part 2.

Biogas and biomethane emissions – a quick win for decarbonising future energy systems?

In our latest blog, Dr Semra Bakkaloglu reflects on our newly published research into biogas and biomethane emissions.

Over 100 years, methane has 27.2 times the global warming potential of carbon dioxide. So when it comes to climate change, it’s pretty potent stuff. Methane concentrations in the atmosphere are increasing, which makes it a quick-win target in the drive to decarbonise our global energy system.

It’s no coincidence that over 100 countries signed the Global Methane Pledge at COP26 in Glasgow. The pledge is a commitment to reduce methane emissions by 30% (from 2020 levels) by 2030. But a 30% reduction is ambitious, not to mention a complete reversal of the current trajectory of increasing methane emissions. Achieving that will require a combination of measures, which include reducing emissions from the existing supply chain whilst also reducing reliance on natural gas as a fuel by switching to cleaner energy alternatives, such as electrification or hydrogen.

But those new energy alternatives are at wildly different stages of technological readiness and require major infrastructure changes and investment. They are unlikely to happen overnight – and many are unlikely to become mainstream within the next 8 years.

One sector that is expected to grow and contribute to decarbonisation in that transition period is biogas and biomethane – a mixture of gases (mostly methane (CH4 and carbon dioxide (CO2)) produced from biodegradable materials. It’s a technology with a lot of factors in its favour: the volume of organic waste – known as feedstock – generated by modern societies is increasing, it provides a beneficial alternative disposal method for that waste, and conversion of energy from waste to biogas can begin to replace fossil fuel gas – which in turn reduces overall greenhouse gas (GHG) emissions. Ultimately it contributes to meeting those government commitments.

But biogas and biomethane production can also emit methane and it’s an area that’s been lacking in research. No study has assessed methane emissions from the biogas and biomethane supply chain – until now.

For our recent study, we synthesised methane emissions from the biogas and biomethane supply chains by breaking down stages and identifying key elements from direct measurements studies. We used a statistical model Monte Carlo approach to estimate aggregate methane emissions with uncertainty assessment, which can account for up to 343 g CO2-eq. We observed that biogas and biomethane supply chains exhibit similar emission characteristics to oil and natural gas with super-emitters present at all stages. In our study, 62% of the emissions come from just 5% of the point sources – these super-emitters waste a disproportionately large amount of methane

“..62% of the emissions come from just 5% of the point sources – these super-emitters waste a disproportionately large amount of methane.”

The International Energy Agency’s (IEA) inventory, (the only other benchmark data currently available) estimated total methane emissions from bioenergy to be 9.1 Tg in 2021.

Our study, which only looked at one aspect of bioenergy (biomethane), discovered that methane emissions are more likely to be in the range of 6.4 – 7.8 Tg per year (95th percentile), but the average methane emissions are around 2.8 Tg according to the IEA’s global biogas and biomethane generation rate 1.47 EJ in 2018. If biogas and biomethane production are expanded to the same scale as the oil and natural gas industries and no action is taken, they could emit almost 4 times as much methane as oil and gas supply chains (82.5 Tg in 2021). At present, our results indicate they are high – higher even than natural gas, which is clearly a worry.

Considering the latest IPCC-AR6-WG3 climate change mitigation scenarios that achieve the Paris Agreement 1.5°C temperature rise mitigation target with low or no overshoot, we can see that biogas and methane could have up to 28 EJ of production by 2050. Using our mean emissions rate (52.3 g CO2-eq per MJHHV) from this study, this would result in 53.8 Tg methane emissions. This drives home the point that it is extremely important to reduce biogas and biomethane emissions for these energy sources to play a constructive role in our future energy system.

Finding and removing these large emitters is a critical step toward significantly reducing overall emissions from biomethane and natural gas supply chains. It’s not just about controlling greenhouse gases either. There’s a significant economic argument for addressing emissions – all that lost gas has a commercial value.

According to the European Biogas Association (EBA), biomethane can be produced for as little as €55 per MWh, while natural gas costs around €80 per MWh. When our findings are combined with the cost of biomethane, we can calculate that emitting 2.8 Tg of methane per year in average (based on the IEA’s global biomethane and biogas generation rate for 2018) can result in an average a global economic loss of 2.4 billion euros in average.

“… emitting 2.8 Tg of methane per year can result in a global economic loss of €2.4billion in average.”

Through improved design, detection, measurement, and repair techniques, much of the observed emissions can be avoided. If we focus on super-emitters, there are some potential quick wins too. We found that the digestate stage and upgrading units need the most attention in this regard. There’s a lot of overlap with oil and natural gas supply chains too – preventing gas venting, reducing flaring activities and designing a closed unit with a vapour recovery system can all contribute to reducing emissions.

Additionally, we need better regulations, continuous emission measurements, and close collaboration with biogas plant operators in order to address methane emissions and meet the Paris Agreement temperature target.

We know what we need to do to tackle those emissions; the important thing is to get started right away. Biomethane is an important renewable energy source, but it could be even better! Combating biomethane emissions is not only significant for meeting Paris Agreement’s target but also boosting the global economy.

Hydrogen and other short lived climate pollutants – is the time horizon important?


Dr Jasmin Cooper, Research Associate here at Imperial’s Sustainable Gas Institute, shares the work being done to model the potential global warming impacts of H2 emissions in possible future supply chains.


Short lived climate pollutants are greenhouse gases which stay in the atmosphere for much less time than carbon dioxide (CO2). Despite this, they are much more powerful than CO2 and can trap as much heat as thousands of kilograms of CO2 on a mass-to-mass basis (Table 1).

Table 1: Properties of different greenhouse gases (Derwent, 2018, Derwent et al., 2001, Derwent et al., 2018, Derwent et al., 2020, Field and Derwent, 2021, Forster et al., 2021, Myhre et al., 2013, IPCC, 2007).
Greenhouse gas GWP over 500-year time horizon GWP over 100-year time horizon GWP over 20-year time horizon Lifetime in the atmosphere
Carbon dioxide 1 1 1 Hundreds of years
Methane 7.6 29.8±11 82.5±25.8 12 years
Black carbon 900±800 3,200 (+300/-2,930) A few weeks
Hydrofluorocarbonsa 435 1,526±577 4,144±1,160 15 years
Hydrogen 4.3 to 10 Four to seven years
afor the hydrofluorocarbon HFC-134a.

In recent years methane (CH4) has emerged as the most important short lived climate pollutant with the IPCC’s AR6 report finding that emissions of it must be cut for 1.5°C or 2°C temperature targets to be met (IPCC, 2021, McGrath, 2021). This is because it is, at present, the second most important greenhouse gas, being responsible for around 30% of global warming to date (McPhie, 2021). It is also the second most emitted greenhouse gas e.g. in 2019 the UK’s total greenhouse gas emissions were 80% CO2, 12% CH4, 5% nitrous oxide and 3% fluorinated gases (BEIS, 2021). As energy systems move away from fossil fuels, hydrogen (H2) could replace natural gas in areas that are difficult to decarbonise through electrification, such as heavy industry and heat.

H2 is a greenhouse gas, but unlike CH4 it is an indirect greenhouse gas. It does not absorb and trap heat but interferes with other (direct) greenhouse gases by enhancing their warming potential (Derwent, 2018). Therefore, in a world where H2 is used in a way akin to natural gas is now, there is the potential for H2 to be emitted into the atmosphere and contribute towards global warming. While there is limited literature available which estimates the impacts of it in the atmosphere, some as-yet to be peer reviewed research suggests short-term forcing from H2 could be higher than that of methane.

Here at the SGI, we have been modelling the potential global warming impacts of H2 emissions in possible future supply chains. When a 100-year time horizon is considered, H2 will likely not impose extra burdens to meeting Paris Agreement goals. However, if shorter time horizons and other climate metrics are considered, the impacts of H2 could be greater, as short-lived climate pollutants exhibit the majority of their warming impacts in the first few years of being emitted. This is an area where more research is needed, as it is important to fully understand the climate impacts of H2 if it is to become a key energy source.

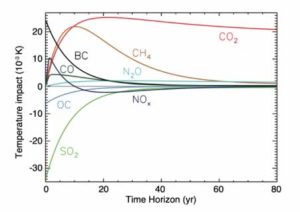
Figure 1: Temperature response curve of various greenhouse gases (Myhre et al., 2013).

Whilst short lived climate pollutants are important, CO2 is still the most important greenhouse gas because its atmospheric lifetime is long (hundreds of years), and its warming effect is stable (Figure 1). Therefore, when comparing greenhouse gases and creating strategies to tackle global warming, it is important that attention not be drawn away from CO2 i.e. making large cuts to methane emission cannot be used as an excuse to slow down rates of decarbonisation. While short lived climate pollutants are important in the fight against climate change, caution should be used when pitting greenhouse gases against one another based on their GWP, especially GWP over 100-year horizons.

This could lead to unintended consequences either side. For example, a shift away from the importance of CO2 resulting in decarbonisation rates slowing down, or non-CO2 greenhouse gases not being given enough attention and consequentially little action being taken to mitigate emissions.

Overall, the time-horizon considered when comparing greenhouse gases to other another is important but what is more important is the quantity of greenhouse gases emitted. GWP is a useful metric to promote the importance of emissions abatement of non-CO2 greenhouse gases, but its importance becomes less pronounced when emissions are vastly reduced.


References 

BEIS. 2021. 2019 UK Greenhouse Gas Emissions, Final Figures London, UK; Department for Business, Energy and Industrial Strategy (BEIS). Available:’ https://assets.publishing.service.gov.uk/government/uploads/system/uploads/attachment_data/file/957887/2019_Final_greenhouse_gas_emissions_statistical_release.pdf

Derwent, R. 2018. Hydrogen for heating: atmospheric impacts – a literature review London, UK; Department for Business, Energy and Industrial Strategy (BEIS). Available:’ https://www.gov.uk/government/publications/atmospheric-impacts-of-hydrogen-literature-review

Derwent, R. G., Collins, W. J., Johnson, C. E. & Stevenson, D. S. 2001. Transient Behaviour of Tropospheric Ozone Precursors in a Global 3-D CTM and Their Indirect Greenhouse Effects. Climatic Change, 49, 463-487. 10.1023/A:1010648913655

Derwent, R. G., Parrish, D. D., Galbally, I. E., Stevenson, D. S., Doherty, R. M., Naik, V. & Young, P. J. 2018. Uncertainties in models of tropospheric ozone based on Monte Carlo analysis: Tropospheric ozone burdens, atmospheric lifetimes and surface distributions. Atmospheric Environment, 180, 93-102.

Derwent, R. G., Stevenson, D. S., Utembe, S. R., Jenkin, M. E., Khan, A. H. & Shallcross, D. E. 2020. Global modelling studies of hydrogen and its isotopomers using STOCHEM-CRI: Likely radiative forcing consequences of a future hydrogen economy. International Journal of Hydrogen Energy, 45, 9211-9221. https://doi.org/10.1016/j.ijhydene.2020.01.125

Field, R. & Derwent, R. 2021. Global warming consequences of replacing natural gas with hydrogen in the domestic energy sectors of future low-carbon economies in the United Kingdom and the United States of America. International Journal of Hydrogen Energy.

Forster, P., Storelvmo, T., Armour, K., Collins, W., Dufresne, J. L., Frame, D., Lunt, D. J., Mauritsen, T., Palmer, M. D., Watanabe, M., Wild, M. & Zhang, H. 2021. The Earth’s Energy Budget, Climate Feedbacks, and Climate Sensitivity. In: Climate Change 2021: The Physical Science Basis. Contribution of Working Group I to the Sixth Assessment Report of the Intergovernmental Panel on Climate Change Cambridge, UK and New York, USA; Cambridge University Press. Available:’ https://www.ipcc.ch/report/ar6/wg1/downloads/report/IPCC_AR6_WGI_Full_Report.pdf

IPCC. 2007. Climate Change 2007: The Physical Science Basis. Contribution of Working Group I to the Fourth Assessment Report of the Intergovernmental Panel on Climate Change, Cambridge, UK and New York, USA; Cambridge University Press. Available:’ https://www.ipcc.ch/site/assets/uploads/2018/05/ar4_wg1_full_report-1.pdf

IPCC. 2021. AR6 Climate Change 2021: The Physical Science Basis, Geneva, CH; Intergovernmental Panel on Climate Change (IPCC). Available:’ https://www.ipcc.ch/report/ar6/wg1/

McGrath, M. 2021. Climate change: Five things we have learned from the IPCC report. BBC News.

McPhie, T. 2021. International Methane Emissions Observatory launched to boost action on powerful climate-warming gas [Press Release]. Brussels, BE. Available: https://ec.europa.eu/commission/presscorner/detail/en/IP_21_5636.

Myhre, G., Shindell, D., Bréon, F. M., Collins, W., Fuglestvedt, J., Huang, J., Koch, D., Lamarque, J. F., Lee, D., Mendoza, B., Nakajima, T., Robock, A., Stephens, G., Takemura, T. & Zhang, H. 2013. Anthropogenic and Natural Radiative Forc- ing. In: Climate Change 2013: The Physical Science Basis. Contribution of Working Group I to the Fifth Assessment Report of the Intergovernmental Panel on Climate Change, Cambridge, UK and New York, USA; Cambridge University Press. Available:’ https://www.ipcc.ch/site/assets/uploads/2018/02/WG1AR5_Chapter08_FINAL.pdf