In Methane origins part two we pondered the methane plateau of the early noughties. For part three the Sustinable gas Institute’s Dr Semra Bakkaloglu looks at what has happened since, and where the science points in figuring out the relentless rise in the concentration of methane in Earth’s atmosphere.
Methane concentrations are a two-way street. We know that the rise in the mole fraction (the measure of concentration in the atmosphere) for the gas can be attributed to two things; changes in the relative amounts and totals of emissions from biogenic, thermogenic, and pyrogenic sources, or its destruction through natural methane sinks – Nisbet et al., 2019.
So, which is it – is more being produced? Or is less being destroyed? It is an important question, because – as Nisbet et al also pointed out – the accelerating increase in concentration is enough to push us past Paris Agreement target limits.
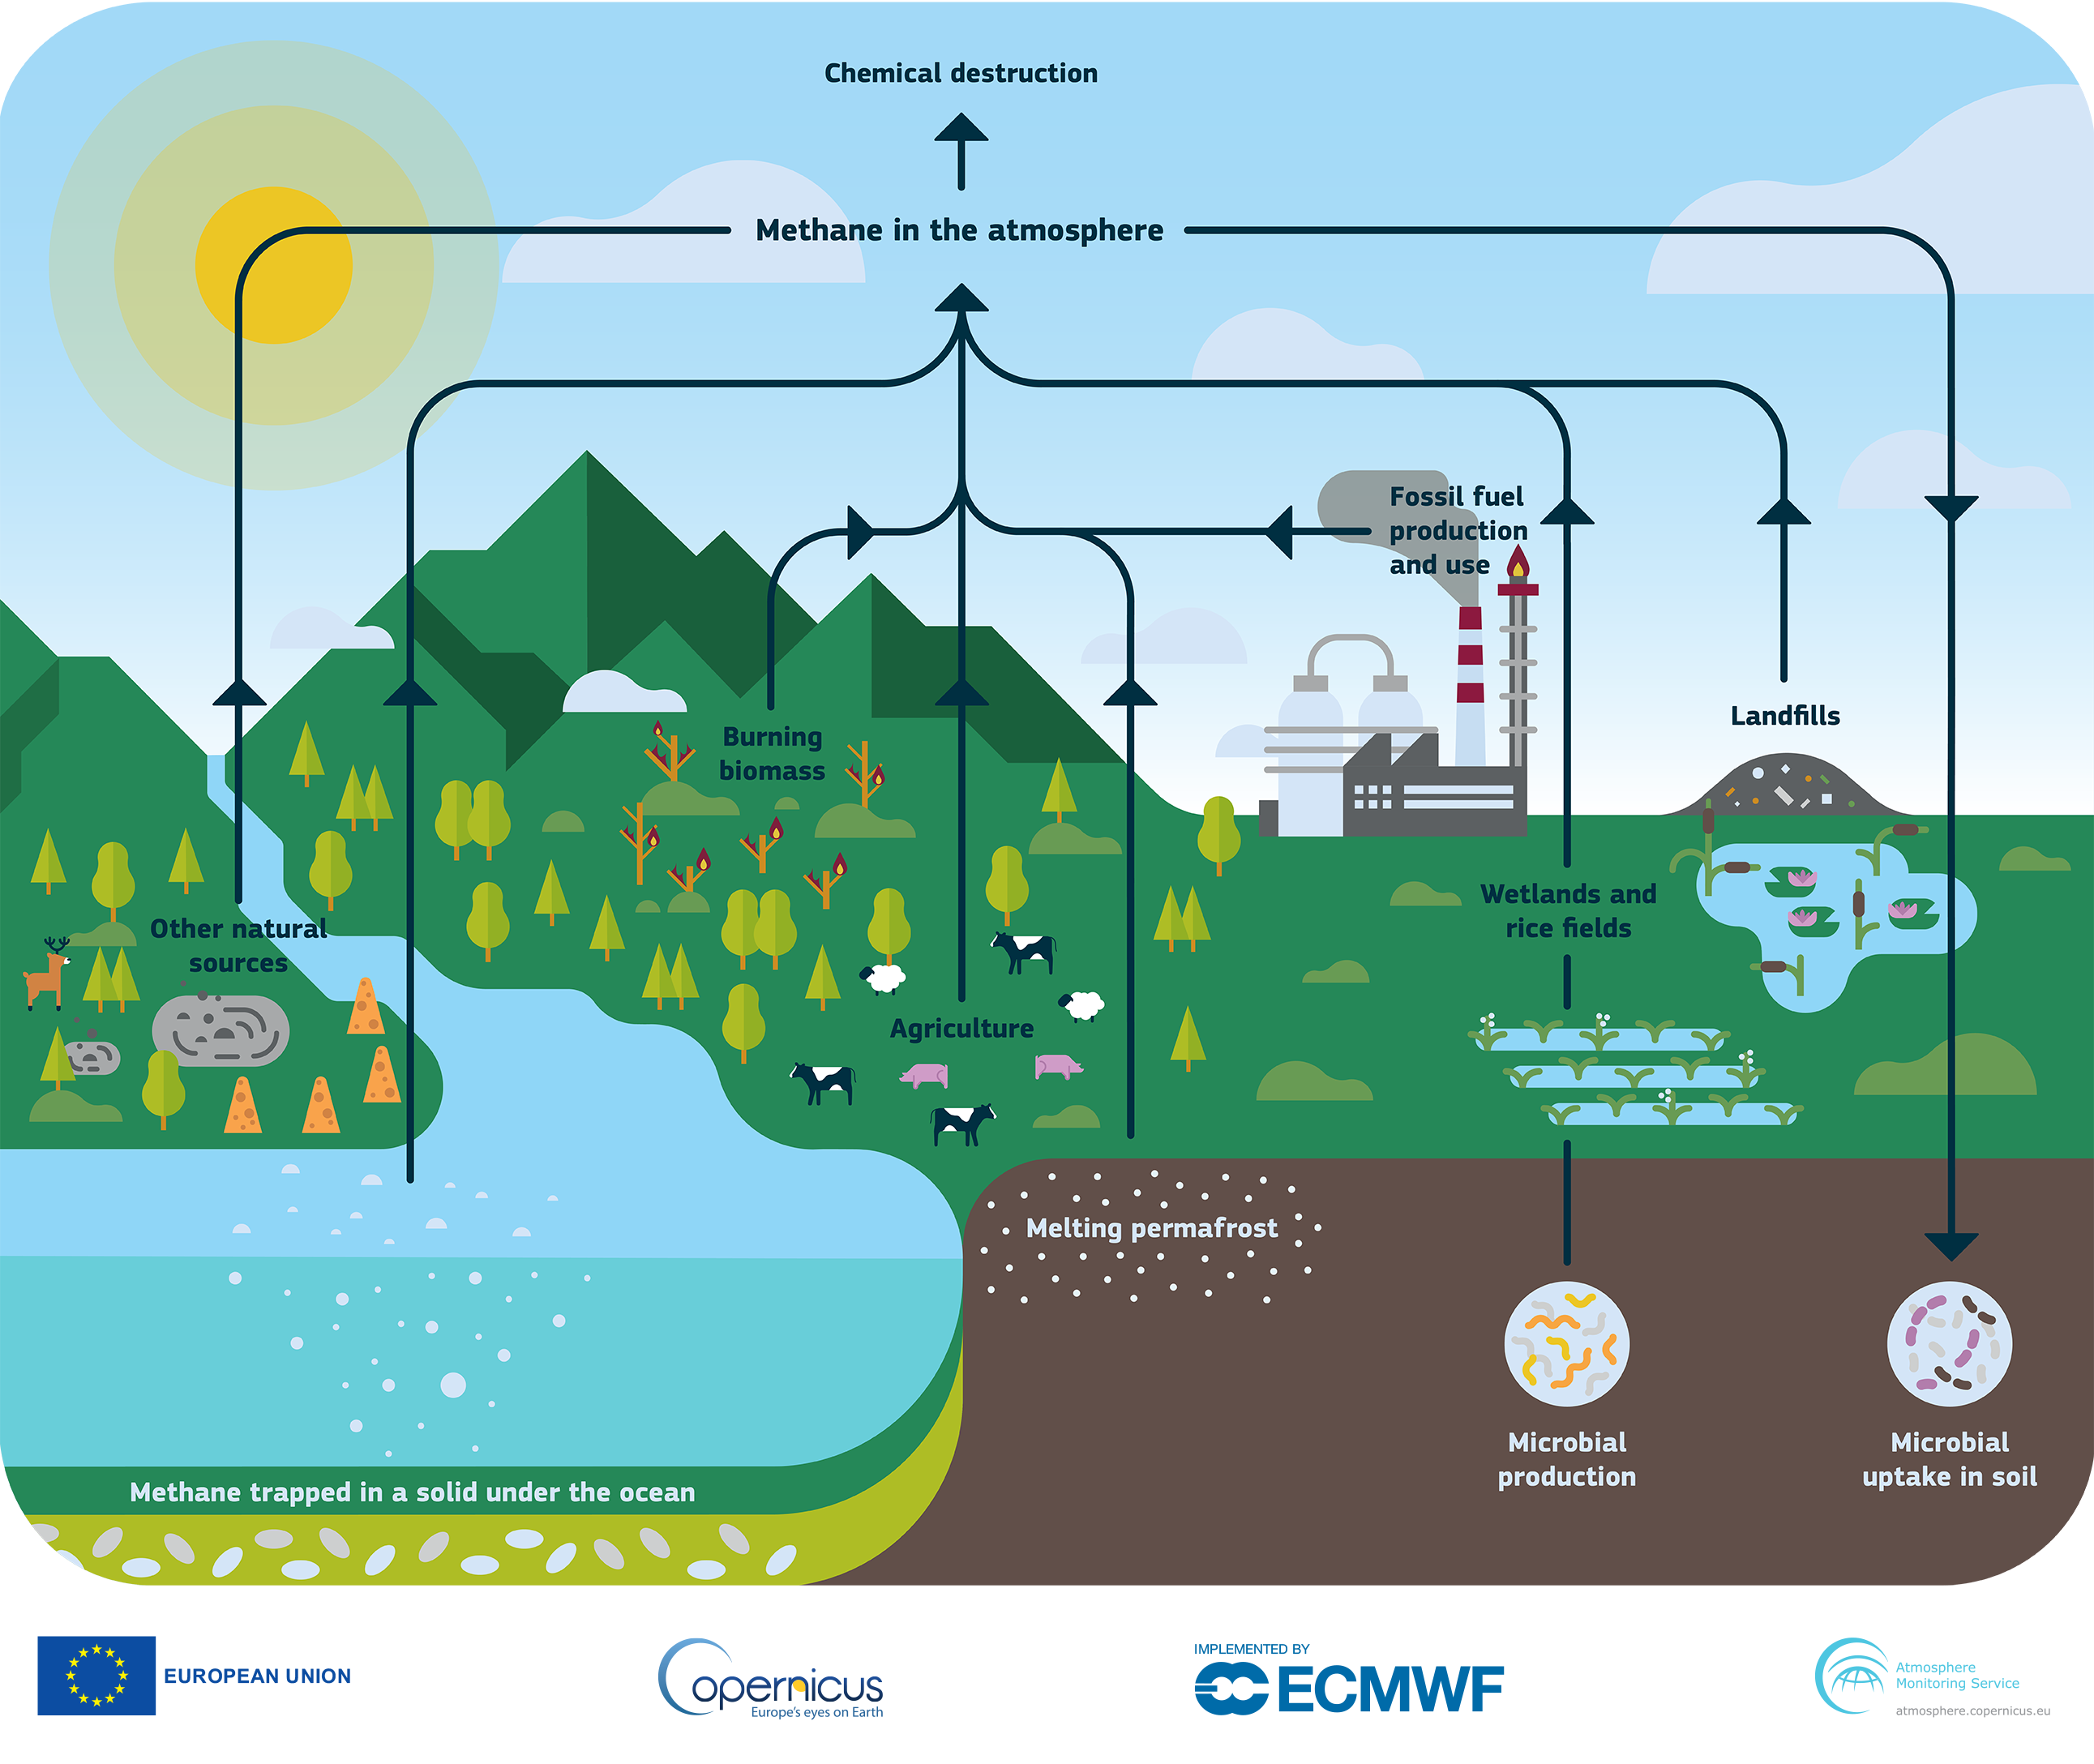
Unfortunately, that’s not easy to answer – the Methane cycle (fig 1) is a complex thing.

So – remember part I? If you don’t, here’s a quick refresher on isotopic δ 13C – CH4 source signatures. To better understand the methane origins – the δ 13C – CH4 are defined as:

δ values are reported in per mille (‰), relative to the international standard materials Vienna Peedee Belemnite (VPDB) for δ13C.
So let’s investigate the research to see what scientists say about the increase in atmospheric methane concentration after 2006.
A 2022 study by Drinkwater et al examined satellite remote sensing data which suggested both – evidence of lighter atmospheric methane isotopic signature changes (which tend to indicate increasing natural emissions), coupled with a decrease in destructive rate via Hydroxyl radical (OH) sink mechanisms.
But in 2021 Zhang et al argue that anthropogenic emissions are responsible for atmospheric methane increases as current process-based wetland CH4 models cannot explain the fact that a significant rise in emissions from natural wetlands caused a decrease in atmospheric δ 13C – CH4 values.
If we are considering increasing anthropogenic emissions from biogenic sources, it is important to focus on livestock emissions since they are the largest source in the global methane budget. Research by Chang et al in 2019 suggests that ruminants’ enteric emissions played a larger role in the observed decline of δ13C in atmospheric methane from 2000 to 2012.
In my own paper, we examined waste source signatures and reported that the isotopic signature of CH4 – sourced from biogas plants and active landfills – exhibits more significant reductions in the 13C isotope compared to CH4 obtained from other waste sources.
We also know that governments are adopting the practice of diverting biowaste away from landfills towards anaerobic digestions, which is a beneficial strategy for mitigating methane emissions. These might explain the rise in CH4 mole fractions with a lighter isotopic signature.
So, what about the contribution of oil and gas emissions to increasing atmospheric methane levels? The methane isotopic signature being lighter suggests a decrease in oil and gas emissions. But recent International Energy Agency (IEA) data contradicts that. Methane emissions from the oil and gas sector have been increasing – so either the industry is getting very good at tackling supply-chain emissions, or we need to question whether we are missing something and investigate how the isotopic signature of methane from the oil and gas sector has been evolving.
A study in 2022 by Menoud et al supports that theory, reporting that the fossil fuel source signature could have been more depleted (more negative, lighter) in recent years.
Overall, it is evident that a great number of factors are responsible for the increase in atmospheric CH4 with a lighter isotopic signature. It is crucial to note that the atmospheric chemistry of methane is highly complex, and the main source of uncertainty when using δ13C data to distinguish between different methane sources, especially in methane sink mechanisms, as observed by Basu et al in 2022.
It is not going to be a clear-cut answer, but a plausible explanation includes the rise in emissions from agriculture and waste as well as fossil fuels with possible contributions from wetlands and a weakening sink. But we need significantly more observations to completely understand the global CH4 budget and key atmospheric processes in order to reduce the uncertainties associated with δ13C data in methane source differentiation.