Author: Zara Qadir

Does gas hold a future with the Paris climate targets?

FaceLeonie Marie Emilie Orhan is a student on the MSc Sustainable Energy Futures course at Imperial College. She previously did her undergraduate at the University of Warwick in Mechanical Engineering. Leonie wrote a summary blog post about the latest white paper, ‘Best uses of natural gas within climate targets’ and launch event.

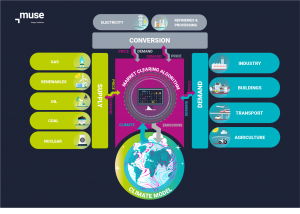
The sixth white paper from the Sustainable Gas Institute ‘Best uses of natural gas within climate targets’ focuses on the future uses of natural gas within the 1.5°C Paris climate targets for both 2050 and 2100. Through the analysis of different gas use scenarios (and energy mixes) from the Intergovernmental Panel on Climate Change (IPCC), it highlights the uncertainties in the future use of natural gas and highlights the potentials of Carbon Capturing and Storage (CCS) and of hydrogen in decarbonisation. It also focuses on the impact policies have on the development and growth of these industries through investment attractivity.

The presentation (watch the launch video) was hosted by the author, Dr Jamie Speirs, a Research Fellow at the Sustainable Gas Institute and the Centre for Environmental Policy, and co-authors, Luke Dubey, a Research Assistant at the Sustainable Gas Institute, and Naveed Tariq, a PhD Researcher from the Department of Chemical Engineering at Imperial College London.

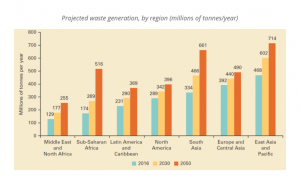
Gas use differs across regions

It is evident that natural gas usage must be reduced not only to attain the 1.5°C targets, but also to conserve fossil fuel reserves for applications which do not yet have viable substitutions. A large majority of the scenarios agree with this, with large variations in different regions. The report shows that Europe’s consumption is set to drop rapidly through substitutions to greener solutions, while in Asia, natural gas would increase until 2050 (before decreasing) due to a growing middle class which relies on affordable energies. I found that highlighting these differences brought light to the individuality of solutions required if they are to consider not only the environmental perspective, but also the social and economic facets.
The importance of carbon capture and storage


Natural gas use was also shown to decrease significantly faster without carbon capture and storage (CCS) than with CCS. This demonstrates that to meet the 1.5°C targets while allowing a more significant transition period to other more sustainable energies, CCS must develop quickly. However, CCS development is controlled by economic incentives and policies as these are needed to be in place to draw in investments to enable the growth of the CCS industry.

Natural gas and hydrogen

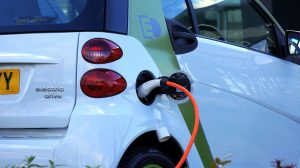
In sectors for which decarbonisation is more difficult, such as domestic heating or transport, hydrogen could provide a substitute for the use of natural gas. Currently, hydrogen can be separated into blue and green hydrogen: blue hydrogen is produced using natural gas and green hydrogen using renewable energies. Due to the high costs of green hydrogen production, blue hydrogen is currently more favourable to the economy. Although its production does contribute to greenhouse gas emissions, its growth is necessary to pave the way for green hydrogen. This is due to the infrastructure needs of hydrogen production, storage, and distribution.

The UK government has stated in its recent Hydrogen strategy that both CCS and hydrogen will be essential to decarbonisations with notable milestones based on an increase in hydrogen production (1GW by 2025 and 5GW by 2030), an increase in CCUS clusters (2 by 2025 and 4 by 2030) and hydrogen heating and hydrogen town trials in 2025 and 2030. This shows a\strong interest from the government in these economies, as the UK seeks to transition quickly to enable a strong economic growth.

The White Paper points out that the scenarios analysed are based on the current knowledge of greenhouse gas emissions, which lacks an understanding of methane global warming potentials and may be affected by other factors in the future. This points out the need for a regular analysis and updated predictions and shows that there could be discrepancies between the scenarios presented and the future.

One of the main points I feel was conveyed in the report and presentation was the lack of policies to incentivise the growth of CCS and hydrogen production, which have the potential to play large roles in reaching the 1.5°C targets. Policies would need to centre around the development of the infrastructures required, the realignment market regulations to meet the demands of CCS and hydrogen, and agreements for international trade of hydrogen.The differences in hydrogen demand depending on how strong policies were really illustrated these points, with few and weak policies resulting in a demand over three times smaller than for strong ones, while with policies whose strengths and numbers are at a theoretical maximum, the demand came close to twice that of strong policies.

Expert views on the report

Dr Susana Moreira, a Senior Gas Specialist at The World Bank, offered a commentary which outlined the importance of investing in more electricity grids to cope with the demand and ease the changes in economy required to pave the way to a net zero future. Another pertinent point was that of connecting everyone to the grid and the adjustment that gas producing countries would have to make, not only to their electricity structures, but also to their economies. The impact of hydrogen production to the environment and communities was also pointed out. Overall, her commentary brought light on economic, social, and environmental issues which are key factors in the consideration of a net zero future.

Martin Lambert, a Senior Research Fellow at the Oxford Institute for Energy Studies, focused his commentary on emphasising the need of investments and policies required to do so.

Overall, the paper shows that to meet the 1.5°C targets, CCS and hydrogen must benefit from policies to encourage investments and regulations to direct the market as meeting the targets requires reliance on CCS and hydrogen. I feel more emphasis should have been placed on the idea that although the population is projected to increase to over 10 billion by 2100 (UN Population Facts, December 2019) natural gas usage is predicted to decline.

Speaking at the Royal Society’s Rising Methane Scientific Meeting

Blog post written by Dr Semra Bakkaloglu 

Dr Semra Bakkaloglu is a research associate at the Sustainable Gas Institute (SGI), who works on the Methane and Environment Programme. We asked her to write a short blog post about a recent Royal Society meeting on tackling methane emissions where she was an invited speaker. 

Scientists from all around the world gathered at the Royal Society ‘Rising methane: is warming feeding warming’ online meeting on October 4-7, to present and discuss the global methane budget, satellite observations of methane, natural and anthropogenic methane emission sources, and strategies for methane emissions mitigation and removal.

Despite efforts taken in many countries to reduce emissions, methane mole fraction (the amount of methane) is rising globally. It is important to understand what is causing the rise in methane concentrations as the rise makes meeting the goals of the 2015 Paris Agreement more difficult. However, the causes of methane growth and evidence from carbon isotopes (for example, the depletion in Carbon-13 isotope) is largely unknown: sources of methane emissions may be increasing, and sinks (methane being removed from the atmosphere) may be declining, or both processes may be occurring together (Nisbet et al., 2020). A sink occurs when methane is removed from the atmosphere by oxidation in a reaction with hydroxyl radical (OH).

A graph
UK methane emissions inventory between 1990-2019 (NAEI,2021)

I was excited to be invited to present the results of my PhD study on Day 4 during the industrial session. One of the points I emphasised during my presentation was the significance of methane emissions from biogas plants, as well as how these emissions are often overlooked in inventories. I also highlighted the differences in the isotopic signatures from waste sources, such as there being more depleted in Carbon-13 (13C) for active sites in landfill areas compared to closed sites, and different feedstock release different isotopic signatures. Wastewater treatment also influences the isotopic signature in terms of whether treatment is aerobic (requires oxygen) or anaerobic.

Understanding the evolution of waste generation and treatment processes can lead us to develop new methods to reduce emissions from these sources. The more information we have on the isotopic signature, the easier it is to evaluate specific waste sources on a regional and global scale. With these data, we can better understand the Carbon-13 temporal trends of the global methane record and gain a better understanding of the reasons for the rise in methane. More details can be found in our paper in Waste Management published in August.

My old PhD supervisor, Dr Dave Lowry from Royal Holloway University of London (RHUL), spoke next and demonstrated the changes in the isotopic signature of the UK source mix over time. Biogenic sources, such as wetlands, agricultural and waste sources, are dominant in rural areas, with Carbon-13 isotopic signatures ranging from -65 to -60‰, whereas gas leaks are the dominant methane source in urban areas. Over the last 30 years, the methane source mix has been depleted by 8‰ due to a number of reasons. For example, an increase in methane recovery systems and reductions in the amount of waste disposed at landfill sites, as well as a gradual decline in the proportion of isotopically-enriched southern North Sea Gas in the UK distribution network and a decline in anthracite (hard coal) production and move from deep to open cast mining. Julianne Fernandez, a PhD student in RHUL, assessed methane emissions from London gas network and found that London emits far more methane than Paris. Dr. Lowry and his team’s research will help local governments to prioritise methane mitigation strategies so as to meet the new target of the US-EU pact on the Global Methane Pledge of at least a 30% reduction in methane by 2030.

The next speaker was Prof. Grant Allen of the University of Manchester, who discussed how to quantify methane emissions. He talked about the progress being made in unmanned aerial vehicle (drone) measurements of methane and other greenhouse gases, as well as how drone-based sampling of methane concentrations can be used to calculate emission fluxes from landfills, fracking sites, and dairy herds.

The final speaker was Dr Stefan Schwietzke from the Environmental Defense Fund. Stefan highlighted the inconsistencies and low biases in many emission inventories, and emphasised the importance of measurements in guiding mitigation and tracking progress. His talk focused on the currently understudied offshore oil and gas sector. He concluded by drawing attention to ongoing efforts to improve transparency in the fossil fuel industry’s emissions reporting by incorporating empirical estimates and integrating them with independent datasets (for example, satellite data and field studies).

The industrial methane session informed us of ongoing international efforts to limit the global methane budget. Understanding and quantifying the anthropogenic methane emissions and their isotopic signature are critical to improving our understanding of the methane cycle and its anthropogenic component. This way, we can mitigate climate change and achieve emission reduction strategies outlined in the 2015 UN Paris Agreement on Climate change.

The entire discussion can be viewed on the Royal Society’s YouTube channel.

How important could blue hydrogen assumptions be?

Co-authored by Luke Dubey, Dr Jasmin Cooper and Dr Semra Bakkaloglu from the Department of Chemical Engineering at Imperial College 

In this short blog post, researchers at the Sustainable Gas Institute examine the literature to explore the environmental footprint and carbon credentials of blue hydrogen. 

As COP26 approaches attention towards decarbonising and meeting climate targets has intensified. Hydrogen has been pitched as a solution to reducing emissions in hard to decarbonise sectors, such as heavy industry, maritime freight, and aviation but now questions have been raised over whether hydrogen could actually make it harder to meet our climate targets. In August 2021, a paper was published by researchers at Cornell University (Howarth and Jacobson, 2021) which found that blue hydrogen would emit 20% more CO2 equivalent (the metric used to measure and compare emissions from multiple greenhouse gases) than burning natural gas. The findings were widely reported in the media but there has been some backlash due to key assumptions made in the paper. The publication also coincided with the release of the UK government’s hydrogen strategy, in which there is the intention to invest heavily in blue hydrogen. It is important the UK’s blue hydrogen ambitions do not conflict with the climate change action leadership it is aiming to set during COP26.

The validity of (methane leak rate, capture rate) made in the paper have already been highlighted by experts at SINTEF in a recent blog. Our team decided to compare the paper’s assumptions with values we found in the literature (Table 1) and run a sensitivity analysis to place the results against contemporary literature. For the methane leak rate, research by Paul Balcombe and others at the Sustainable Gas Institute in 2017 found emissions from the natural gas chain to range from 0.5 to 3.5%. This compares to the higher level in the Cornell paper at 3.5%. The Oil and Gas Climate Initiative (OGCI) has also committed to a total loss rate of 0.2% by 2025, which would reduce emissions even further.

In ‘A greener gas grid: what are the options?’, Dr. Jamie Spiers (2017) looked at the efficiency of the blue hydrogen conversion process and found a range of values between 60 and 90% for steam methane reforming (SMR) process. The efficiency rate was assumed to be much lower in the paper at 55%. The capture rate of the carbon capture and storage (CCS) process also has a wider range of values from 72 to 96% for a new hydrogen plant in a IPCC report (2018) than reported in the paper. Other recent studies have also found even higher efficiencies and capture rates are expected when producing hydrogen using autothermal reforming (ATR) processes, which was not considered in the original paper.

Table 1: Assumptions made in Howarth and Jacobson paper and our current analysis

Assumption Howarth and Jacobson Current analysis
Steam methane reforming (SMR) Conversion efficiency 55% 55-90%
Methane leak rate 3.5% 0.5-3.5%
CO2 capture rate from SMR process 85% 72-96%
Global Warming Potential (GWP) of methane 86 (20-year time horizon) 36 (100-year time horizon) and 86 (20-year time horizon)


We then ran a sensitivity analysis using these literature values found as the limits of the assumptions, including the Howarth and Jacobson estimate when it fell outside the range. This allowed us to examine a fuller range of possible outcomes and more clearly compare blue hydrogen to natural gas. By assuming a uniform distribution between the literature values, we ran over 2 million combinations of these assumptions to see where the estimate in the Howarth and Jacobson paper placed against the current literature. We kept all other assumptions from the paper the same.

Histogram

Figure 1: Histogram of results from changing assumptions in this work. The x axis shows the percentage greenhouse gas footprint (CO2 eq) of blue hydrogen is larger or smaller than natural gas. E.g. 10 = 10% higher GHG emissions, -20 = 20% lower emissions.

When we examine these alternative assumptions/inputs we can see that the Howarth and Jacobson estimate is on the periphery of all possible results. Demonstrating that the headline results, while possible, portray blue hydrogen in an unfairly bad light. Moreover, this is only possible as we have included the assumptions made in the paper as possible literature results. The estimate from the paper lands in the bottom 1% of all the results assessed. Therefore, while it could be argued the results are possible, they are certainly not a fair representation of the current state of knowledge.

Overall, while the Howarth and Jacobson paper raises some good points surrounding capturing the whole life cycle emissions of any alternative fuel source, it also fails to accurately represent the systems in which the energy is being used. Pushing for green hydrogen appears a sensible option at first glance, however, it may be necessary to use some blue hydrogen in the near term to enable the greater use of green hydrogen later. This is reflected in the IPCC scenarios that meet 1.5°C, with considerable quantities of blue hydrogen used in the pre-2050 period (IPCC, 2021).

As governments worldwide attempt to reach net zero, accurately representing the carbon credentials of emerging solutions is of paramount importance. It is also important to be credible with any assumptions made in any assessment of all possible solutions. Here, I feel this paper has fallen short. Yet we must still ask ourselves whether blue hydrogen, although not as bad as the paper proclaims, has a place in future energy systems, particularly in the post-2050 years. As the UK hosts, COP 26 is this investment in blue hydrogen, rather than solely green hydrogen demonstrating the leadership expected from a country such as ours.


Can Hydrogen Help Us Combat Climate Change? – Examining the Hydrogen Supply Chain

This blog post was co-authored by Dr Semra Bakkaloglu, Dr Jasmin Cooper, and Mr Luke Dubey.

Hydrogen is a low carbon fuel as it produces zero carbon dioxide when burnt and because of this, it has taken centre stage in the fight against climate change. However, a recent publication has raised questions on how effective it is in decarbonising the global energy mix. While it is positioned to replace fossil fuels in the global energy mix, there is growing uncertainty on whether it is as ‘clean’ and ‘green’ as people say it is. Several nations, such as the UK, Japan and Canada, have unveiled their decarbonisation strategy with hydrogen replacing natural gas, in addition to committing to ambitious, world-leading projects to promote it as a fuel in low carbon energy systems. For example, the UK’s recent hydrogen strategy aims for 5 GW of low carbon hydrogen production by 2030 (BEIS, 2021). Hydrogen has the potential to change the way we power our lives and could be critical in combating climate change and achieving net-zero goals.

Currently, hydrogen is mostly used in industrial (e.g. oil and gas refining, chemicals production, fertiliser production) applications and is not an important fuel source (i.e. it is not used in electricity generation and domestic heating). Most of the world’s hydrogen is made from fossil fuels (natural gas and coal) but only a small percentage is made using electrolysis (water splitting in electrolysers). The hydrogen supply chain is not simple. Hydrogen can be produced from a wide range of materials (water, fossil fuels, biomass) and there are numerous technologies available for converting these materials into hydrogen. Because of the complexity in production routes, a colour code is often used when referring to hydrogen.

What colour is hydrogen?

For hydrogen produced from fossil fuels there is:

  • Black hydrogen produced from black coal and the carbon dioxide produced during the process is released to the atmosphere.
  • Brown hydrogen made when brown coal is used to make hydrogen and the carbon dioxide produced during the process is released to the atmosphere.
  • Grey hydrogen made from natural gas and the carbon dioxide produced during the process is released to the atmosphere.
  • Blue hydrogen made from coal or natural gas but differs in that the carbon dioxide produced is captured and stored in underground storage e.g., salt caverns, depleted oil and gas fields.
  • Turquoise hydrogen is produced from natural gas, but solid carbon is produced instead of carbon dioxide.

When hydrogen is produced using electrolysis, the electricity source determines the colour code used:

  • Green hydrogen is when the electricity is from renewable sources (wind or solar).
  • Pink hydrogen is when the electricity is generated by a nuclear power plant- can also be referred to as red or purple hydrogen.
  • Yellow hydrogen is when grid electricity, or a mix of electricity sources (renewable, fossil fuels, nuclear) is used to power the electrolyser. It can also describe hydrogen produced from solar powered electrolysers.

Is hydrogen as clean as we think?

Here at the Sustainable Gas Institute (SGI) at Imperial College London, we have been investigating methane emissions and the importance of this greenhouse gas (GHG) since 2015. Methane is a potent GHG with a global warming potential (GWP)* of 29±11 (Forster et al., 2021) and therefore, reducing the amount of methane in the atmosphere is critical for limiting the impacts of global warming and climate change.

In the atmosphere, methane reacts with hydroxyl radicals (OH molecules) which breaks down methane to carbon dioxide. This is the main sink for methane i.e., the main source of removing methane from the atmosphere. However, hydrogen in the atmosphere will also reacts with these radicals and therefore reduces the amount available to remove methane. As a result, hydrogen is an indirect GHG which means it does not absorb and emit heat but will enhance the warming impacts of methane in the atmosphere.

We know from previous work at the Institute that gas supply chains emit methane and given that hydrogen will likely play an important role in displacing natural gas, hydrogen emissions are likely to occur in a similar fashion. Recent studies have estimated the GWP of hydrogen to be between 1.9 and 9.8 (Derwent et al. 2020, Derwent 2018). Thus, emissions from hydrogen supply chains may pose a risk to net-zero emission targets. This is contradictory to how hydrogen is often portrayed as a silver bullet for combating the climate change. Therefore, understanding where in the supply chain these emissions occur, as well as how much is emitted is vital to understanding its total effect on net-zero targets.

We are also currently modelling hydrogen emissions from a variety of supply chains (local use in the UK, international trade, green and blue hydrogen) to estimate the amount of hydrogen which could be emitted into the atmosphere and the climate change impacts of these emissions. If these emissions are not accounted for then we risk overshooting climate budgets. With so much investment being planned, and many governments’ energy strategies relying on its widespread use, it is imperative we learn more about its potential emissions.

If you want to find out more about our work, please visit our website or contact us at sgi@imperial.ac.uk.

Glossary:

Global Warming Potential is the a measurement of the heat absorbed by a gas in comparison to the heat absorbed by carbon dioxide. For example, methane has a GWP of 29+/-11, which means 1 kg methane will absorb the same amount of heat as 28+/-11 kg of carbon dioxide.

References:

Derwent, R. 2018. Hydrogen for heating: atmospheric impacts – a literature review London, UK; Department for Business, Energy and Industrial Strategy (BEIS). Available:’ https://www.gov.uk/government/publications/atmospheric-impacts-of-hydrogen-literature-review

Derwent, R. G., Stevenson, D. S., Utembe, S. R., Jenkin, M. E., Khan, A. H. & Shallcross, D. E. 2020. Global modelling studies of hydrogen and its isotopomers using STOCHEM-CRI: Likely radiative forcing consequences of a future hydrogen economy. International Journal of Hydrogen Energy, 45, 9211-9221. https://doi.org/10.1016/j.ijhydene.2020.01.125

Forster, P., T. Storelvmo, K. Armour, W. Collins, J. L. Dufresne, D. Frame, D. J. Lunt, T. Mauritsen, M. D. Palmer, M. Watanabe, M. Wild, H. Zhang, 2021, The Earth’s Energy Budget, Climate Feedbacks, and Climate Sensitivity. In: Climate Change 2021: The Physical Science Basis. Contribution of Working Group I to the Sixth Assessment Report of the Intergovernmental Panel on Climate Change [Masson-Delmotte, V., P. Zhai, A. Pirani, S. L. Connors, C. Péan, S. Berger, N. Caud, Y. Chen, L. Goldfarb, M. I. Gomis, M. Huang, K. Leitzell, E. Lonnoy, J. B. R. Matthews, T. K. Maycock, T. Waterfield, O. Yelekçi, R. Yu and B. Zhou (eds.)]. Cambridge University Press. In Press.

How should the biodegradable waste management strategy respond to net zero?

In this blog, Dr Semra Bakkaloglu, a research associate at the Sustainable Gas Institute (SGI) for the Methane and Environment Programme, examines how and why the waste sector needs to be overhauled to achieve net zero emissions.

Tractor and landfill
Landfill (Source: Pixabay)

With the COP26 less than three months away, countries are invited to come up with ambitious 2030 emission reduction targets that match the mid-century net zero. The public have also demonstrated their support for sustainability and expressed a desire for immediate action. However, net zero is not possible unless the waste sector is overhauled.

Waste is a global issue. Municipal solid waste generation has increased significantly in recent decades as a result of population growth and urbanisation. The World Bank expects global waste to increase to 70% by 2050 from that generated in 2018. The 1.6 billion tonnes of CO2-eq emissions estimated for 2016 is projected to rise to 2.6 billion tonnes by 2050 (Kaza et al., 2018). Emissions from the waste sector account for about 5% of global greenhouse gas (GHG) emissions (World Bank, 2018). Emissions are primarily caused by disposal in open dumps and landfills without landfill gas collection systems.

The World Bank, Trends in solid waste management.

Methane, which is produced by the decomposition of organic waste, is the largest contributor of GHG emission in the waste sector. It is 28-34 times more potent than CO2 over a 100-year period (Etminan et al., 2016). Endeavours to formalise the waste management can cut GHG emissions substantially. Although the waste sector had a major relative reduction in GHG emissions of 20% over the other sectors between 1990 and 2015 (UNFCC, 2015) due to a number of factors, including improved landfill standards, increase in landfill gas recovery being used for energy, changes in waste type sent to landfill and decrease in food waste amount, further mitigation of remaining emissions is getting tougher.

Waste management strategies have changed recently. With the UK government commitment to achieving “Net-Zero” emissions by 2050, all biodegradable waste will be eliminated from landfill by 2025, with food waste separated from inorganic waste collections (CCC, 2019). Additionally, EU waste legislation will require separate biodegradable collection by 2024, as well as a new target of no more than 10% waste landfilling by 2035 (EU methane strategy, 2020). These rapid changes in the composition of new waste inputs to landfills are changing the landfill gas production rate and composition (Bakkaloglu et al., 2021a). However, in a recent study we demonstrated that biogas plant could be a significant source of methane emissions. Diverting biodegradable waste to anaerobic and composting plants can help reduce landfill emissions and provide sustainable energy, but it may also contribute significantly to methane emissions from biogas plants unless necessary mitigation measures are implemented.

What actions need to take?

Further reduction of emissions from waste sector requires systematic approach, following:

• Cutting down on food waste
• More incentives for the collection and usage of organic wastes or residuals from farming
• More emission measurements on composting and biogas facilities
• Monitoring of biogas plant emissions on a daily basis
• Improvement of leaks caused by poor biogas plant design or maintenance
• Capturing of landfill emissions by effective gas recovery system and topsoil cover materials
• Minimizing the uncertainties in measured emission caused by methodological and meteorological conditions
• Revising the default landfill oxidation values for closed and active landfill sites to improve emission inventories
• Better regulations for monitoring measurements, reporting of emissions by companies and verification of emissions

In order to assess waste management strategies, more research is needed to estimate emissions from the biomethane supply chain and composting facilities, as well as monitor landfill emissions over time.

We can employ our resources, such as food waste, sludge, garbage and even wilted autumn leaves to generate sustainable energy for a decarbonised future. However, further research on waste to biomethane technologies, as well as reliable monitoring and reporting methodologies are essential to achieve net zero goal.

References:

Bakkaloglu, S., Lowry, D., Fisher, R.E., France, J.L., and Nisbet, E.G.. 2021a, Carbon isotopic characterisation and oxidation of UK landfill methane emissions by atmospheric measurements. Waste Management.
https://doi.org/10.1016/j.wasman.2021.07.012

Bakkaloglu, S., Lowry, D., Fisher, R.E., France, J.L., Brunner, D., Chen, H. and Nisbet, E.G., 2021b. Quantification of methane emissions from UK biogas plants. Waste Management, 124, pp.82-93. https://www.sciencedirect.com/science/article/pii/S0956053X21003809

Etminan, M., Myhre, G., Highwood, E. & Shine, K. Radiative forcing of carbon dioxide, methane, and nitrous oxide: A significant revision of the methane radiative forcing. 2016. Geophysical Research Letters 43, 12,614-612,623.

EU Methane Strategy, 2020. Web page https://ec.europa.eu/energy/topics/oil-gas-and-coal/methane-emissions_en#eu-methane-strategy-, accessed on 29 July, 2021.

Kaza, Silpa; Yao, Lisa C.; Bhada-Tata, Perinaz; Van Woerden, Frank. 2018. What a Waste 2.0 : A Global Snapshot of Solid Waste Management to 2050. Urban Development;. Washington, DC: World Bank. © World Bank. https://openknowledge.worldbank.org/handle/10986/30317 License: CC BY 3.0 IGO.

Word Bank, 2018. Trends in Solid waste management. Web page : ttps://datatopics.worldbank.org/what-a-waste/trends_in_solid_waste_management.html accessed on 29, July 2021.

UNFCCC. 2017. “National Greenhouse Gas Inventory Data for the Period 1990–2015.” United Nations Framework Convention on Climate Change. http://unfccc.int/resource/docs/2017/sbi/eng/18.pdf.


Book review: “The BOOM” by Russell Gold

‘A nuanced overview of successes, barriers and lessons learned from the American shale gas revolution.’

Our first book review has been written by Pooya Hoseinpoori, a researcher in energy system modelling and policy making at Sustainable Gas Institute, Imperial College London. In this review, she looks at a book that explores the American shale gas revolution. Pooya believes both supporters and opponents of fracking will find this book interesting in understanding the alternative viewpoint.

Over the last decade, the global gas market has experienced significant transformations that greatly impacted traditional gas relations and geopolitics worldwide. With the US shale boom, the growing LNG trade, and the emergence of new gas-producing states, natural gas has become an abundant commodity, and its supply is no longer constrained to regional markets. Among these developments, the American shale boom has had the most profound impact on the abundance of natural gas, reducing gas prices and changing the flow of international gas trades.

Due to the rise in natural gas production from unconventional resources, the United States` energy landscape has transformed significantly in the past decade. By 2010 a combination of disruptive technologies, innovative practices, and an accommodating regulatory environment facilitated the shale revolution, turning the US from a major natural gas importer into a gas exporter. Advancements in hydraulic fracturing, horizontal drilling and seismic imaging were the three main technological advancements that made it possible to extract hydrocarbons from previously inaccessible shale formations and opened vast deposits of natural gas for economic growth in the US. The result was a 50% increase in proved reserve and a 34 % increase in US gas production over the past decade. The shale revolution had a profound impact on greenhouse gas emissions in the US by facilitating the transition from coal to gas. In addition, the abundance of natural gas drove down US gas prices significantly, giving a competitive advantage to its industry. The large-scale extraction of shale deposits has also affected the global oil and gas market and energy security through the growing LNG trading.

Although the shale boom reduced the long-term energy security risks in the US, it has some major environmental risks, making it a controversial technology. Tens of thousands of wells have been drilled across the Unites States and this has led to the growing concerns about the impacts of fracking on ground/surface water resources and local air pollution. Due to the widespread nature of the shale business, it has a large community impact and people are confronted with the process of energy production in a way that they haven’t in the past. This has led to growing public opposition to it. On the other hand, although climate change is part of the shale boom story, many believe that the fugitive emissions from shale gas could offset the emission reduction gains of switching from coal to gas.

Russell Gold is an investigative journalist at the Wall Street Journal based in Texas. For over a decade, he travelled around the United States tracing fracking to drilling sites, farms, companies and interviewed drillers, market analysts, engineers, environmental activists, local residences and landowners to present a comprehensive overview of the shale revolution. In his book, “The BOOM”, he delivers a thorough and balanced analysis into the benefits and disadvantages of fracturing and the growing conflict between economic development, energy independence and environmental damages. I believe both supporters and opponents of fracking will find this book helpful in thinking about alternative viewpoints.

Gold’s book provides important insights into how energy change takes place. In his book, Gold elaborates on how the institutional structure of the United States, in particular private ownership of minerals, facilitated the emergence of fracking and how setting consistent government policies aligned with the right market forces created a fertile ground for the deployment of this disruptive technology. The science and engineering of hydraulic fracturing are well explained. The book also provides interesting information about the history and early fracking attempts, such as using nuclear weapons for fracking.

The Boom is the story of how the coordination of different stakeholders facilitated the biggest energy innovation of the last century. What I liked the most about the book was the interviews with people who were closely involved in this transition and its focus on the human side of adopting this provocative technology. Gold does a great job at capturing the great ambitions and personalities that drove the shale boom. There are the engineers of Mitchell Energy who first figured out how to use chemically slicked water to fracture shales; the investors at Devon who first committed to combine hydraulic fracturing with horizontal drilling enabling engineers to improve the well’s output and make it profitable; Chesapeake’s McClendon who figured out how to finance the revolution and sell it to wall street bankers; the landowner and local residents who had to live with the side effects of fracking and the activists who protested against fracking, trying to force stricter regulations and limit the environmental damages.

Gold concludes by saying natural gas could be a bridging fuel to a future powered by renewable energy and fracking could be the technology that enables that. Despite the consensus on the value of natural gas for reducing urban/regional pollutions, the debate about the role of fracking in addressing climate change and whether natural gas from fracking is net benefit rages on. Being a promising bridging fuel requires further efforts in reducing fugitive methane emissions from the fracking process and gas transport. The other key question is about the future of fracking. Would it deliver the future projected for it? And if shale boom is replicated by other countries and spread globally, how would it affect the energy markets?

Despite the controversial role of shale gas in a clean energy transition, I found the story of the shale boom an interesting account of a change in the energy system and the trade-offs we have to make. I think, as we look ahead to the transition to a low-carbon energy system, there are many lessons we can learn from the shale revolution, including how to create an environment that encourages innovation and enables disruptive technologies to emerge.

References

  • Gold, Russell. 2014. The Boom. Simon & Schuster.
  • Grigas, Agnia. 2017. The new geopolitics of natural gas. Harvard University Press.
  • Michael Greenstone, Jeff Holmstead, Susan Tierney, interview by Amy Harder. 2018. The Fracking Debate, Energy policy institute at the Univeristy of Chicago
  • Murtazashvili, Ilia. 2016. “Institutions and the shale boom.” Journal of Institutional Economics.
  • Richard S. Middleton, Rajan Gupta, Jeffrey D. Hyman, Hari S. Viswanathan. 2017. “The shale gas revolution: Barriers, sustainability, and emerging opportunities.” Applied Energy 88-95.
  • House of Commons, The Energy and Climate Change Committee, 2012. The Impact of Shale Gas on Energy Markets .
  • European Union., 2013. The Shale gas ‘revolution’ in the United States: Global implications, options for the EU ,
  • Hoxtell, A. G., 2012. The Impact of Shale Gas on European Energy Security, Global Public Policy Institute (GPPi).

Pooya works for the Sustainable Gas Institute at Imperial College which explores the role of natural gas in a low carbon world. Research is  needed to understand methane emissions from the oil and gas industry, and to explore the feasibility of alternative fuels such as hydrogen. 

Sucking out the carbon from the atmosphere- can negative emissions technologies help reach climate goals?

A blog post from Dr Jasmin Cooper, Research Associate at the Department of Chemical Engineering and Sustainable Gas Institute.

The atmospheric concentration of carbon dioxide is continuing to rise despite global efforts to decarbonise energy systems and economies. There was a dip in emissions during periods of national lockdown in the 2020 COVID-19 pandemic but as lockdown measures ease, emissions are returning to pre-pandemic levels (Met Office, 2021). It has become evident that the rate of decarbonisation is not matching the pace needed to meet the climate change goals set in the Paris Agreement and therefore cutting fossil fuels alone is not enough to keep global warming to below 2°C or 1.5°C (McGrath, 2020). Therefore, negative emission technologies (NET), such as those which ‘suck’ carbon dioxide out of the atmosphere, have an important role to play in meeting emission targets.

What are NET?

There are a number of emerging NET being used or are emerging, including afforestation and reforestation, direct air capture and bioenergy with carbon capture, some of which are on display in the Science Museum’s Our Future Planet exhibition. These are different to carbon capture for a coal power plant as they remove pre-existing carbon dioxide from the atmosphere, therefore reducing the atmospheric concentration.

Each NET has its pros and cons; afforestation is simple yet effective but requires large numbers of trees (and therefore land) to be planted in order for significant carbon removal. Bioenergy with carbon capture is multifunctional as it generates heat, electricity or liquid fuels, but the feedstock requirements could conflict with other agricultural needs.

Our work on the environmental impacts of NET

At the Sustainable Gas Institute, we have been examining the environmental impacts of NET. Important factors of all NET are their embodied emissions (emissions from the production of materials and energy used by a NET) and life cycle impacts (impacts from all activities, materials and energy consumed by a NET over its entire lifespan). If these are high, then the overall climate change mitigation effectiveness of a NET could be severely reduced. For example, if a NET emits 400 kg CO2eq. per one ton of carbon dioxide removed from the atmosphere, then the total amount of carbon dioxide removed is 600 kg. Emissions occur in the materials and energy supply chains, as well as during activities in the life cycle such as maintenance, construction and waste management. Emissions are not limited to greenhouse gases.

Other chemicals are released into the atmosphere that can have negative impacts to air quality, land and water. No NET is emission free, and the magnitude of emissions ranges greatly both between and within NET, depending on the quantity of materials and energy used and the level of decarbonisation within the materials and energy supply chains. Therefore, it is important that these emissions are taken into consideration when developing NET strategies.

Rate of carbon dioxide removal

Another important factor to consider is the amount of carbon dioxide removed over time. Afforestation and reforestation and enhanced weathering can remove large quantities of carbon dioxide from the atmosphere, but the rate of removal is slow and dependant on factors such as temperature. Direct air capture and bioenergy with carbon capture, on the other hand, can remove large quantities of carbon dioxide from the atmosphere quickly, with capacities of one to four megatons of carbon dioxide per year per facility. However, they are the most sensitive to emissions from their supply chains. Hence, forward planning is an important factor that should be taken into account when devising NET strategies so that variations in rate of carbon dioxide removal are taken into account.

Weighing up the evidence

Overall, NETs do result in a net removal of carbon dioxide across their life cycle but under particular circumstances, the impact of embodied emissions can be so great that there is limited net carbon removal. Therefore, we need to maximise the effectiveness of NET as this is crucial for ensuring no repercussion are experienced from expanding their uptake globally and that there are no further delays to reaching Paris Agreement targets.

References

McGrath, M. 2020. ‘Not enough’ climate ambition shown by leaders. BBC News, 12 December 2020.
Met Office. 2021. Mauna Loa carbon dioxide forecast for 2021 [Online]. London, UK. Available: https://www.metoffice.gov.uk/research/climate/seasonal-to-decadal/long-range/forecasts/co2-forecast [Accessed June 2021 2021].


Creating a Global Energy Systems Model – Dr Sara Giarola

Picture of Dr Sara Giarola
Dr Sara Giarola

We recently interviewed Dr Sara Giarola, Research Fellow at the Sustainable Gas Institute and the lead modeller for the energy systems model, MUSE. We asked her about how policymakers in governments are using MUSE and other models to inform their decision making for COP-26.

What is an energy systems model? Why are they important?

It was the Oil crisis in the 1970s that prompted the development of tools which described the links between energy supply, demand, and their impact on the energy security of many nations in the world. These tools were the first known energy system models.

An energy system model is a mathematical representation of the sources of energy (e.g. renewables and fossil fuels), the destinations for energy (or “end-uses”, which include all the diverse needs of energy of our society, from the electricity consumed in our houses to the electricity used to run electric vehicles), and all the possible ways with which energy can transform from one to another form. For example, wind power can be converted into electricity in wind farms and distributed to our households.

Energy system models can be quite diverse. However, their communal strength relies in combining energy technologies, with environmental (for example, the interactions between energy and climate) and societal factors, and different policies. This makes them privileged tools to evaluate the implications of climate policies and industrial strategies.

What is your background?

Being a chemical engineer, I have always been fascinated by mathematics, especially when used to describe phenomena occurring at any scale, from chemical reactions to interconnected macro-systems. Since my PhD, which was on the optimisation of biofuels in transport, I became interested in energy problems and made energy system modelling one of my main research interests.

A diagram showing MUSE
A diagram of MUSE

What is unique about MUSE?

MUSE (ModUlar energy system Simulation Environment) models all the possible ways in which energy can be transformed on a global scale. It differs from existing models in many ways, but the agent-based nature of the model is particularly important. Models attempt to capture the behaviour of individuals within an environment. MUSE has an accurate description of the investment and operational decisions made in each geographical region and sector.

MUSE, not only describes each energy sector model (e.g., natural gas or renewables) presenting a comprehensive picture of all technologies in the sector, but also captures the diversity of drivers. These drivers are what lead firms and consumers to buy a specific energy technology rather than another one, and build upon factors such as education level, wealth, principles, and socio-cultural context.

How can modellers help policy makers?

In compliance with the Paris Agreement, governments need to take fundamental decisions around their plans of actions for reducing the greenhouse emissions. Energy models can be used to run “what-if” analyses asking questions around the shape of the energy mix in the future. Many of applications will be published in an IPCC Assessment report to be published in 2022.

The upcoming UN Climate Change Conference of the Parties (COP26), will be a milestone review of current achievements and future targets in the decarbonisation process. One of the key questions which the world will have to face will be around securing a global net-zero target by 2050 while keeping the 1.5 degrees limit in temperature increase compared to pre-industrial time. In order to answer this question, the modelling community has been involved in an unprecedented effort to help provide evidence through model inter-comparison studies to help facilitate transparent and robust dialogue between stakeholders.

Who has been interested in the model? Who have you worked with?

MUSE is part of the the Paris Reinforce project and of the Climate Compatible Growth (CCG) programme.

Paris Reinforce builds upon an extensive modelling ensemble comprising five national/regional models for Europe, nine national models for countries outside of Europe, and eight global models. The project focuses on assessing climate policy decision within structured frameworks created around model inter-comparison studies in view of reaching the Paris Agreement targets, building bolder ambitions from existing Nationally Determined Contributions (NDCs) and National Economic and Climate Plans (NECPs).

CCG is a UK-research programme developed in preparation for COP26 to support investment in sustainable energy. Among the many research outputs, CCG analysts have produced a multi-model comparison study where four global energy system models and selected power sector models, were used to investigate the timing and rate of the global coal phase out, which is essential to foster a Paris Agreement-complaint energy system.

What challenges have you faced?

wind energy farm
Wind farm (Source: Pixabay)

One of the main difficulties of the energy system models, is to translate into research questions stakeholders’ concerns: workshops and surveys are important to identify their priorities. Similarly, translating the research finding into a message to policymakers and stakeholders could also be challenging, as models always bear a certain level of approximation of the real-world phenomena due to their inherent mathematical description.

What surprises have you come across?

It is interesting to see where major barriers to decarbonisation may lie. We recently modelled the real market segmentation of the ammonia industry in China, the biggest world ammonia manufacturer. As enterprises vary in size and governance, a net-zero transition becomes less favoured if specific policy mechanisms are absent to ensure competitivity. Therefore, in China, a net-zero ammonia industry would need to go beyond the unique implementation of a carbon tax and adopt more sophisticated subsidy schemes to allow the transition for enterprises with lower access to capital.

How can one find out more?

Information on the MUSE model can be found on the new Imperial College microsite, where you will see who is working on the model, our publications, and of stories from researchers sharing their views on the energy system transformations.

We will also launch our energy system simulator in the next month, where you can explore how the energy mix might evolve between now and 2100.

MUSE will soon be available as an open source software on a Github where you can copy the code, learn how the model works, and suggest ways to improve it, in a truly transparent global collaboration.

Methane emissions from biogas facilities are underestimated

A blog by Dr Semra Bakkaloglu, a Research Associate at the Sustaianable Gas Institute. 

Biogas production could have an important role in renewable energy, reducing the adverse effects on the climate. However, biogas production’s contribution to emissions of the greenhouse gas, methane, is not fully understood. Methane (CH4) is the second most potent and abundant greenhouse gas after carbon dioxide (CO2) but because it only lasts in the atmosphere for short time (a decade) reducing methane emissions could have a more rapid impact on mitigating climate change. Unfortunately, there are significant discrepancies between official inventories of methane emissions and estimates derived from direct atmospheric measurement of biogas plants.  If biogas is to be a solution to climate change, we need to find effective emission methane reduction strategies, and sources also need to be properly quantified.

What is biogas?

According to the United Nations Framework Convention on Climate Change (UNFCCC), biogas is defined as gas generated from anaerobic digesters. Biogas plant feed may be any biodegradable material, such as dedicated energy crops, agricultural residues, organic waste and paper mill waste. The integrated process in biogas plants includes feedstock supply and pre-treatment, gas treatment and utilisation, and recovery, pre-treatment and use of digestate (Wellinger et al., 2013). This comprises 50 to 70% methane, 30 to 50% CO2 and traces (1 to 5%) of hydrogen suphide and ammonia (National Non-Food Crops Centre, 2021). Biogas is used for heating, electricity or both. If biogas is upgraded to biomethane by removing other gases, biomethane has similar properties to natural gas and can be injected into gas grid or used as a road fuel.

Emissions from biogas plants

Biogas production has an important place in renewable energy, reducing the adverse effects on the climate. However, high methane emissions from biogas plants can arise from fugitive emissions. Depending on engine construction, plant design and operation conditions, emissions can occur through venting from compressors, pipes, single large leaks or long-lasting pressure relief valves and incomplete combustions from combined heat and power units.

Biogas plant and field
Figure 1: One of the UK’s biogas plants

Biogas plants not accounted for

Waste practices in the EU and the UK have changed recently as more waste is being diverted from landfill to biogas plants and composting facilities. There are 579 biogas plants in the UK (National Non-Food Crops Centre, 2021) and their number of biogas plants has grown in the last decade (Figure 2). Unfortunately, most have not been included in the National Atmospheric Emission Inventory (NAEI).

The sustainability of biogas plants depends on the land requirement and greenhouse gas accounting (OFGEM, 2018). However, studies have shown that there is often a maximum loss of 9% of the total production rate of methane (Bakkaloglu et al., 2021; Scheutz and Fredenslud, 2019, and Samuelsson et al. 2018). Also, research conducted by my colleagues and I at Royal Holloway in 2021, demonstrated that biogas plants emissions may account for up to 3.8% of the total methane emissions in the UK. This does not include the sewage sludge biogas plants. We therefore need robust, consistent emission measurements in the UK. Legal requirements should also be implemented, not only UK Net Zero Commitment, but also for the sustainability of biogas plants.

Biogas in the UK’s Net-Zero Commitment

Figure 2. Biogas plant market in the UK (Source: Anaerobic Digestion and Bioresources Association, 2019)

On 27 June 2019, the UK government committed to achieving net-zero Carbon emissions by 2050, in line with the UN’s Paris Agreement (Climate Change Committee, 2019). This Agreement sets out many recommendations as to how to achieve net-zero targeted, including:

  • Diversion of all biodegradable waste from landfills to anaerobic digesters or composting facilities by 2025.
  • Measures to reduce emissions from livestock, soils and waste manure.
  • Elimination of food waste as far as possible, and separation of food waste collections
  • Full utilisation of the UK’s biogenic waste sources, including residues from agriculture and forestry.

According to a recent article on the UN website in December 2020, more than 110 countries have a carbon neutral strategy by 2050 but this aim can only be achieved with appropriate reduction methods. As a result of this zero-commitment, biogas plants have assumed a more significant role, not only in the renewable energy market but also in waste strategies.

Although emissions from biogas plants have not, as yet, attracted serious attention, they may jeopardise the net-zero commitment unless the necessary action is taken.

References

What are the best options for road freight transport?

Pedro Gerber Machado, a visiting researcher from the University of São Paulo, Brazil, summarises his recent review paper examining the life cycle emissions for road freight transport. The review was carried out in collaboration with the Institute of Energy and Environment at the University of São Paulo, Brazil.

Author: Pedro Gerber Machado

The transport sector is responsible for around 30% of the world’s energy consumption and 16% of greenhouse gases (GHG) emissions.  To achieve an energy transition to guarantee net-zero emissions, reducing emissions from road transport is fundamental. Diesel is still the most common fuel used for heavy road transport and freight. While worldwide there is a move towards electric vehicles, their environmental benefit in reducing emissions depends on the area’s electricity sources. Our review paper examines the total environmental life cycle emissions of different fuel options and technologies for road freight transport (trucks) in 45 studies.

Electric vehicle
Source: Pixabay

Source of electricity

The source of electricity can make a big difference to greenhouse gas emissions. We found that with greenhouse gas emissions, higher values (3,148–3,664 g/km) are found in places where coal has a significant share in electricity generation. Lower emissions are found where renewables have higher percentages in electricity generation (496 g/km). In China, emissions can reach 5,479 g/km since electricity generation “is mostly from coal.”

Compressed Natural Gas (CNG)

For Compressed Natural Gas (CNG) technology, greenhouse gas emissions vary due to differing efficiency and assumptions about methane leakage during natural gas transportation. But future projections are optimistic due to the potential for improvements in controlling methane emissions (514 g/km in 2050).

Biodiesel

In the analysis, biodiesel had a higher energy consumption and higher emissions profile in the production phase equal to diesel, which is the main reason for its low environmental performance.

Hydrogen

The greenhouse gas emissions intensity from hydrogen varies as it is depends on its method of production such as coal gasification, steam methane reforming (SMR), and hydrolysis. The use of carbon capture and storage (CCS) and liquid or gaseous use also influences its final emission profile.

Fuels vs. diesel

On average, the review showed that biogas, fuel-cell hydrogen, and Liquefied Natural Gas (LNG) have lower emissions in their life cycle than diesel, with a chance of a 57% reduction in emissions for biodiesel, 77% for fuel-cell hydrogen, and 100% chance for biogas. Interestingly, even though biodiesel is a renewable source of fuel that receives significant attention due to its capacity to reduce greenhouse gas emissions, in our review, it had a higher average emission than diesel.

Electric car
Source: Pixabay

Battery electric, hydrogen fuel cells and biogas

We found that if a clean electricity matrix is available, with high renewable energy shares, battery electric vehicles provide the best option. Hydrogen fuel-cells, when hydrogen comes from renewable sources, are also comparable to battery electric vehicles. Biogas can serve as a feedstock for hydrogen production in substituting natural gas in steam methane reform or liquefied for use in Liquid Natural Gas (LNG) trucks.

Further research into biogas emissions, fuel consumption, and its economics is essential. Since biogas production is possible from several sources, it could be suitable for different countries, such as Brazil.

Analysing air pollutants

There is a lack of studies exploring the life cycle of these options when it comes to air pollutants. Even though pollutant emissions in the use phase (for internal combustion options) have received more attention from the scientific community, emissions for the whole life cycle should also be studied. Even so, uncertainties related to the Tank-to-Wheel evaluation can increase the inaccurate values from this side of the analysis and the error propagation, directly impacting the policymakers. For PM2.5, hybrid and LNG options have greater changes in reducing the emissions. Fuel-cell, LNG, CNG, and hybrid trucks have higher chances of reducing nitrogen oxide (NOx) emissions. In contrast, sulphur oxide (SOx) emissions came out inconclusive due to a lack of studies.

But what about the economics…

CNG, LNG, and hybrid trucks were the best options from an economic perspective. CNG has lower life cycle costs and fuel costs in most analyses, with values ranging from 50% lower life cycle costs than diesel to a 2% reduction, to 16% average increase. CNG is the most economical fuel for large fleets that conduct urban operations and can support private infrastructure.

LNG could have a payback time of 2.5 years or lower, considering the price differential mostly in long-haul operations due to its lower fuel costs. However, economic viability could be achieved due to the higher cost of LNG vehicles and maintenance and the limited range of LNG trucks relative to diesel. The studies also showed that the fuel efficiency in LNG trucks could dictate its economic viability. Relative efficiencies of less than 80% reduce the chances of lower costs by 50%.

Finally, hybrid trucks show a total life cycle cost from 10% lower to practically no difference. Although the incremental cost of hybrid trucks is expected to become close to zero in the future, additional investments of more than $35,000 in hybrid technology hinder its viability, especially with low diesel fuel costs.

In the developing world…

The question arises then if the best options regarding GHG and local pollutant emissions will ever be a possibility for developing regions. Even though authors point out that electric trucks could cause an increase in emissions in several places in the world and that it is still necessary to evaluate peak power demand to understand the operational aspects of transport electrification, electric trucks in countries with a high share of renewables have the most radical reductions in GHG. However, being the most expensive options, there is a slight chance that governments in poorer countries or even the private sector will be willing to pay the price, based solely on environmental reasons.

The way to go in these countries has been to continue to depend on diesel. Most recently, the discussion on natural gas use in the transport sector has gained some momentum. Cheaper than other alternative options, natural gas might be an option due to its lower PM emissions, even though other pollutants, or GHG emissions, are higher.